
Autotuner: How to Speed Up Your Rails App
This article was adapted from my Rails World talk “Rails and the Ruby Garbage Collector: How to Speed Up Your Rails App”.
Ruby’s garbage collector is designed to be adaptable, scaling from short Ruby scripts to running apps that serve millions of requests per second. While it’s designed to be adaptable, it may not work optimally for every use case. For this reason, Ruby’s garbage collector supports many (19 at the time of writing) parameters that can be used to tune it. However, the use of these parameters requires knowledge of how the garbage collector works on the inside. It also doesn’t help that there are changes to the garbage collector in every major Ruby release, meaning that some of these parameters may become deprecated and new ones may be added. This implies that you’ll need to understand the changes and might have to retune the garbage collector to regain optimal performance. This complexity often deters Rails developers from tuning the garbage collector.
That’s why we created the Autotuner gem, which analyzes the traffic of your Rails app and gives you suggestions to personalize the garbage collector for your app. Setting it up should be very straightforward by following the two steps in the readme. In this article, we’ll delve into the motivations behind creating this gem, its workings, and our experimentation process with garbage collector tuning at Shopify.
Motivations for creating Autotuner
There are many strategies to speed up a Rails app, such as getting faster servers, improving database queries, or moving more logic into background jobs. However, your app might be spending more time in the garbage collector than you think. In Jean Boussier’s blog post about tuning Ruby’s garbage collector in Shopify’s monolith, tuning the garbage collector decreased the 99.9th percentile time in garbage collector by 87%, from over 1 second to 0.15 seconds. Similarly, in Storefront Renderer, tuning the garbage collector decreased the 99.9th percentile time in garbage collector by 59%, which translated to a 18% reduction in response times.
The garbage collector often disproportionately affects tail latency (e.g. 99th or 99.9th percentile) because it doesn’t usually run very often (if it does, you’ve got another problem!). This is often caused by a major garbage collection cycle (see my blog post if you’re not familiar with the difference between minor and major garbage collection cycles). Surprisingly, most of the major garbage collection cycles run in a Rails app are actually unnecessary. However, due to various heuristics aimed at optimizing other workloads and reducing memory usage, Ruby’s garbage collector ends up running garbage collection cycles much more than necessary. If you know which garbage collector parameters to tune, this is a low-hanging fruit that can significantly improve the response times of your Rails app.
Suppose you’ve figured out how to tune the garbage collector and have optimized it for your Rails app. The next time you upgrade to a new major release of Ruby, which might be less than a year later, you will need to understand what has changed in the garbage collector and might have to retune it to regain optimal performance. Sometimes, an outdated tuning configuration might even slow down your Rails app!
How Autotuner works
Autotuner functions as a Rack plugin, collecting data about the garbage collector before and after each request, as well as the time taken to process the request. After the request completes, it passes all of this data to a list of heuristics, each of which knows about a particular strategy to optimize GC time.
Each heuristic can select the necessary data and may store it to identify trends. For example, let’s take a closer look at the HeapSizeWarmup heuristic, which suggests sizes for the memory heaps after your app has warmed up and reached peak performance. During bootup, your app allocates many objects, causing Ruby’s garbage collector to grow the heap, which means that garbage collection cycles will be ran frequently. This is bad for performance as Ruby’s garbage collector is stop-the-world, meaning that execution of Ruby code is paused while the garbage collector runs. In a Rails app, this translates to longer response times during the warmup phase until the heap stabilizes. The following diagram illustrates this:
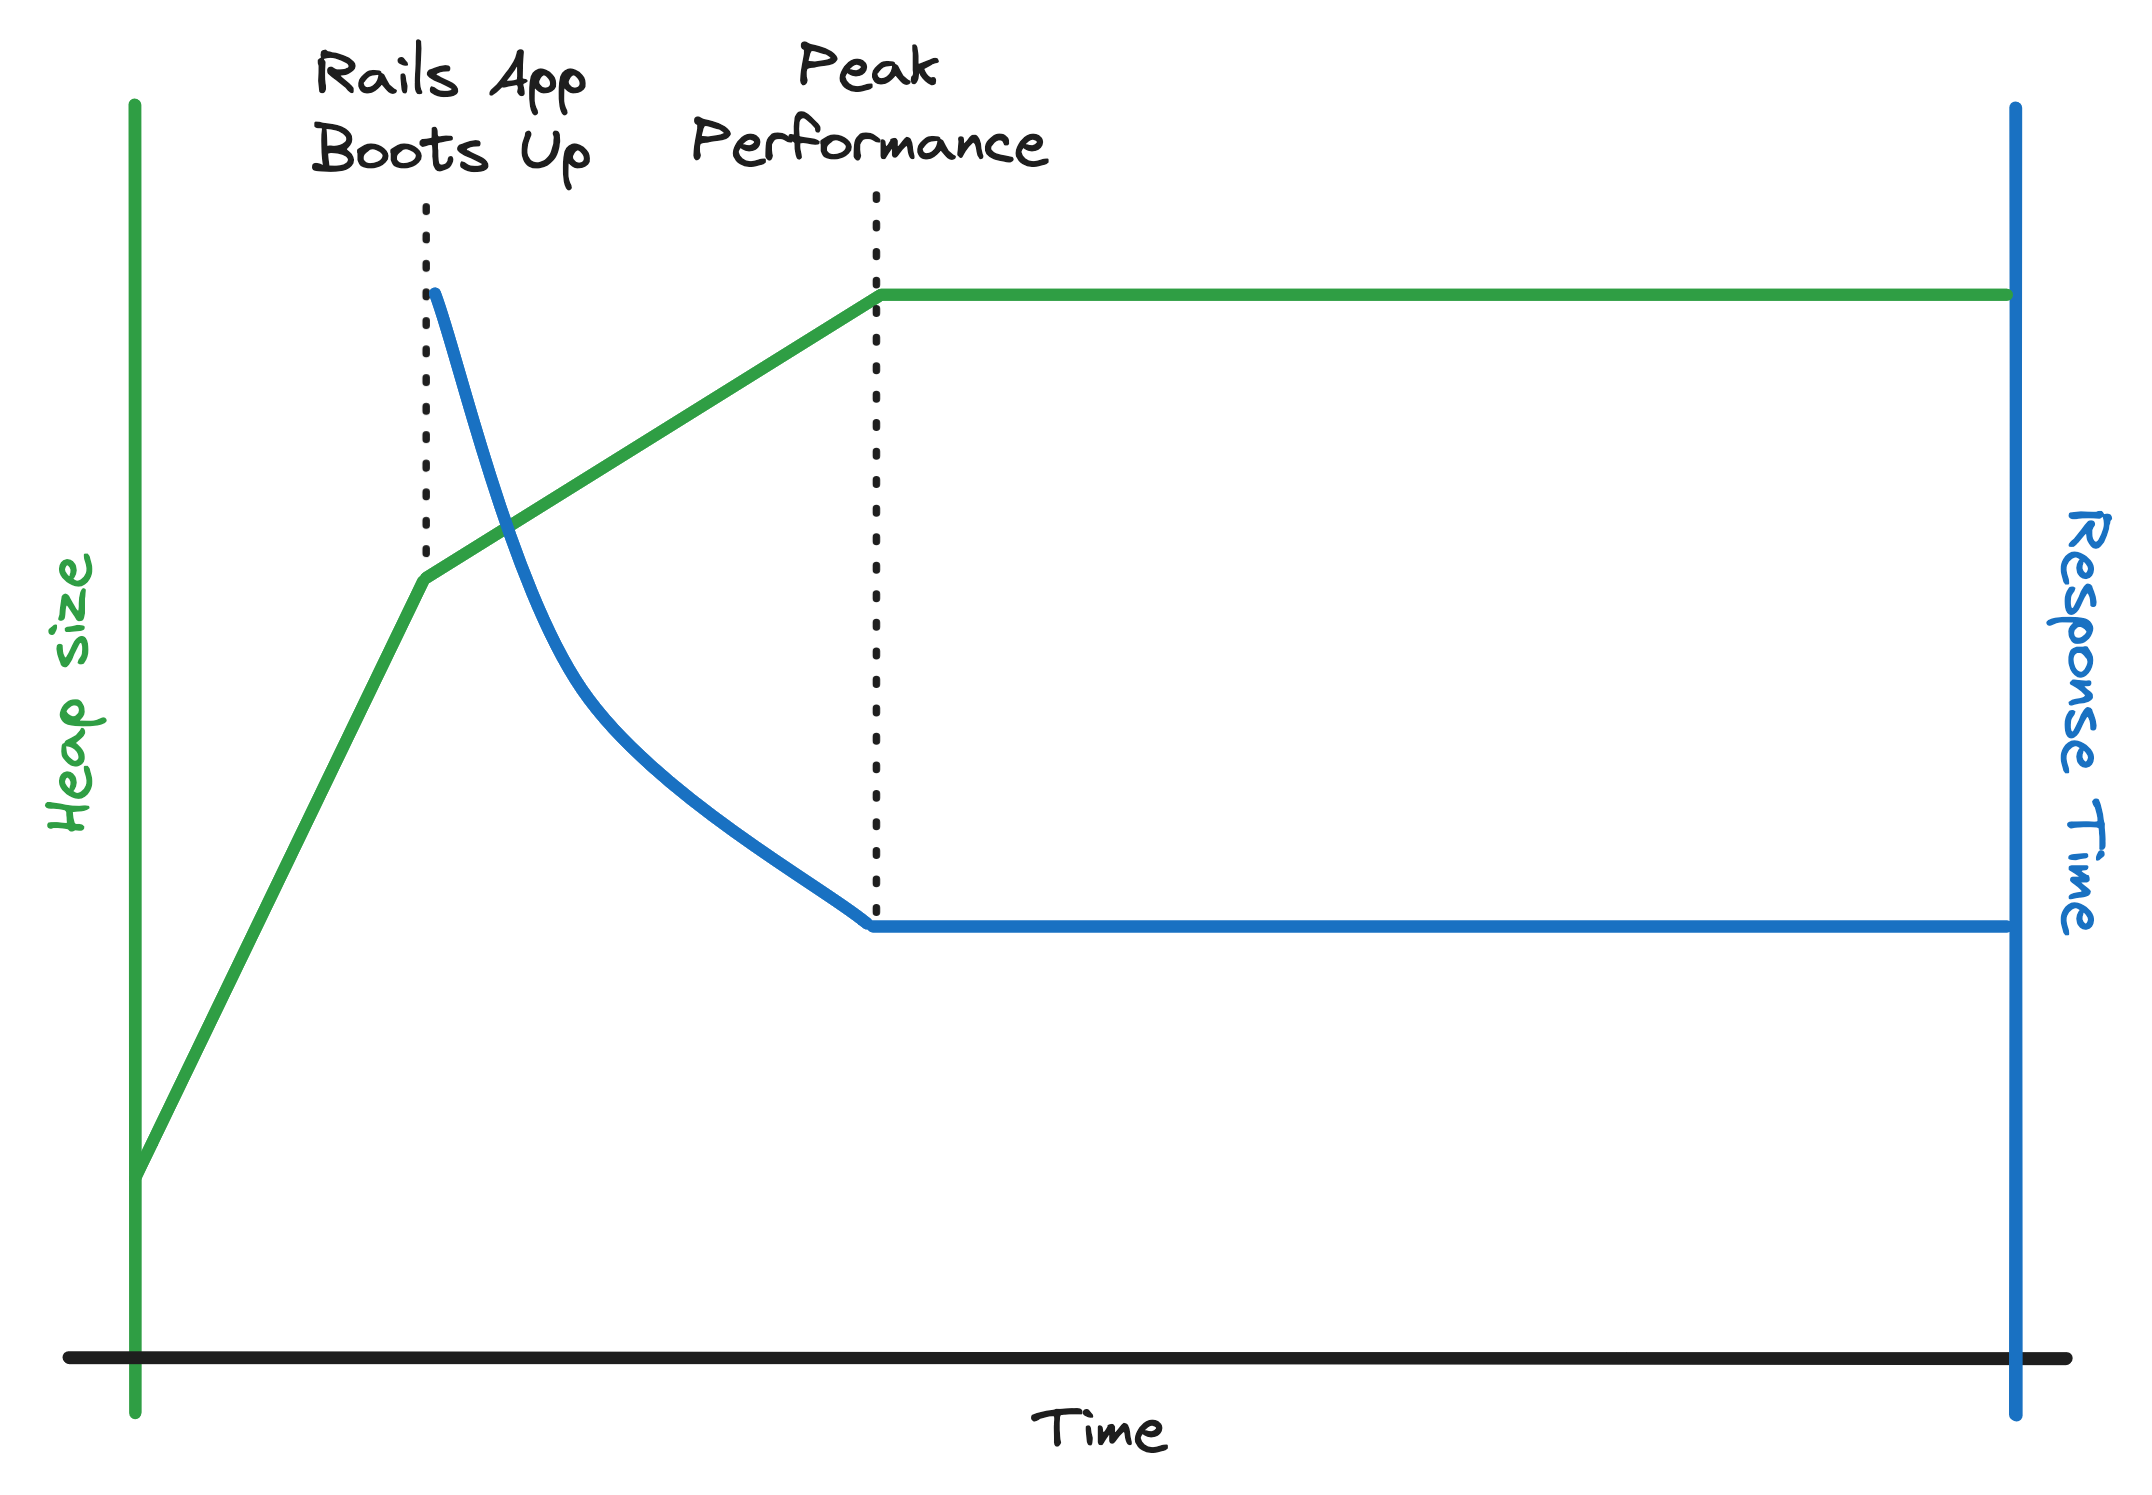
The HeapSizeWarmup heuristic records the time taken for each request and the size of the heaps to determine when the request time has plateaued and peak performance has been achieved. It then suggests values to configure the heaps in Ruby to this size so the heaps will no longer grow at bootup and instead be immediately grown to that size.
Experimenting with garbage collector tuning
Collecting metrics
When performing these experiments, it’s critical to understand the bottlenecks, identify the metrics we want to improve, and know how to measure the improvements. The callback Autotuner.metrics_reporter provided in Autotuner is a good starting point. This is a callback that will report metrics after every request such as the time taken to process the request, the time spent in the garbage collector, the number of major and minor garbage collection cycles ran, and the size of the Ruby heap.
Using these metrics, we can determine whether tuning the garbage collector is worth it or not. There are a few common things to optimize:
- Bootup performance: If your app is slower at boot and spending more time in the garbage collector, then garbage collector tuning may help your app reach peak performance faster.
- Average response times: If your app is spending a high average proportion of the request time in the garbage collector, then tuning the garbage collector can reduce the frequency of garbage collection cycles and improve average response times.
- Extreme (99th, 99.9th percentile) response times: If your app is spending a higher proportion of the request time in the garbage collector in some of the longest requests, then tuning the garbage collector can reduce the impact of the garbage collector on these requests, and bring those extreme response times down.
How we experiment with garbage collector tuning at Shopify
Not all suggestions from Autotuner will positively impact performance. Some of them will be trade-offs. A common one will be trading better average garbage collector and response times while making extremes like 99th or 99.9th percentile worse. A common example of how this can happen is that some tuning decreases the frequency of garbage collection cycles. Running less garbage collection cycles often means that the performance will be better on average, but when a garbage collection cycle does run, it may do more work as there might be more dead objects. Depending on your workloads and requirements, you might not want to sacrifice extreme performance for better average performance.
We’ve found that response times can vary significantly due to factors like load, traffic patterns, and database and cache response times. Because of this, it’s difficult to accurately compare the impacts of the tuning over two different time periods.
Given these reasons, we conduct tests on a small portion of production traffic, dividing it into three groups:
- Untuned: this group has no garbage collector tuning applied. This is a control group to compare the final tuning improvements.
- Stable: this group has garbage collector tuning that yields a positive performance improvement.
- Experimental: this group is where we apply the tuning suggestions from Autotuner one-by-one.
For a high-traffic app, we select around 1-5% of servers for each of the three groups. For a low-traffic app, we select a higher proportion to reduce data variance. Garbage collector tuning is a relatively safe experiment to run; it will usually not cause incidents or significant degradation in performance, so it isn’t too risky to run on a larger portion of traffic.
We follow this process for experimenting with garbage collector tuning:
- Pick one tuning suggestion from Autotuner and apply it on the experimental group.
- Compare the various performance metrics between the experimental group and stable group over a period of several days to a week.
- If the tuning provides a positive performance improvement, apply this tuning suggestion to the stable group as well.
- If the tuning does not provide a positive performance improvement, or gives a trade-off that you do not want, then discard the tuning configuration from the experimental group.
- Repeat step 1 while there’s a tuning suggestion that has not been tried yet.
- Compare the performance between the stable and the untuned groups for total performance improvement.
After this process, your Rails app should ideally be faster! You can now remove Autotuner and redo this experiment when you upgrade Ruby versions or if your app changes significantly.
Conclusion
Ruby’s garbage collector is designed to adapt to various workloads and balance memory usage and performance. It often results in good performance, but not the best performance. Garbage collector tuning allows us to optimize the garbage collector for our specific workload and the metrics we care about. However, for many Rails developers, Ruby’s garbage collector is a black box, making it difficult to find ways to tune it. The Autotuner gem is designed to assist you in finding ways to enhance the garbage collector performance of your Rails apps. In this blog post, we’ve explored the motivations for tuning the garbage collector, how Autotuner works, and how to experiment with changes from Autotuner. For complete documentation on how to set up Autotuner, check the readme.