
Monitoring YJIT in Production
YJIT is a JIT compiler for Ruby that Shopify has developed. In 2022, we enabled YJIT in all storefront requests and observed ~10% speedups. Do you use an app performance monitor like NewRelic or Scout, or check your daily performance graphs? Here’s how you can make sure YJIT is doing what you want when you monitor.
Use what you already have
We work hard to make YJIT efficient on various workloads without relying on you to monitor YJIT metrics
or tune YJIT parameters. All you need to do is build Ruby with YJIT enabled and turn it on with RUBYOPT=--yjit.
See this documentation for details.
If you want to check how your application is doing with YJIT, just using what you already monitor might be enough. The following metrics would be particularly helpful.
Latency
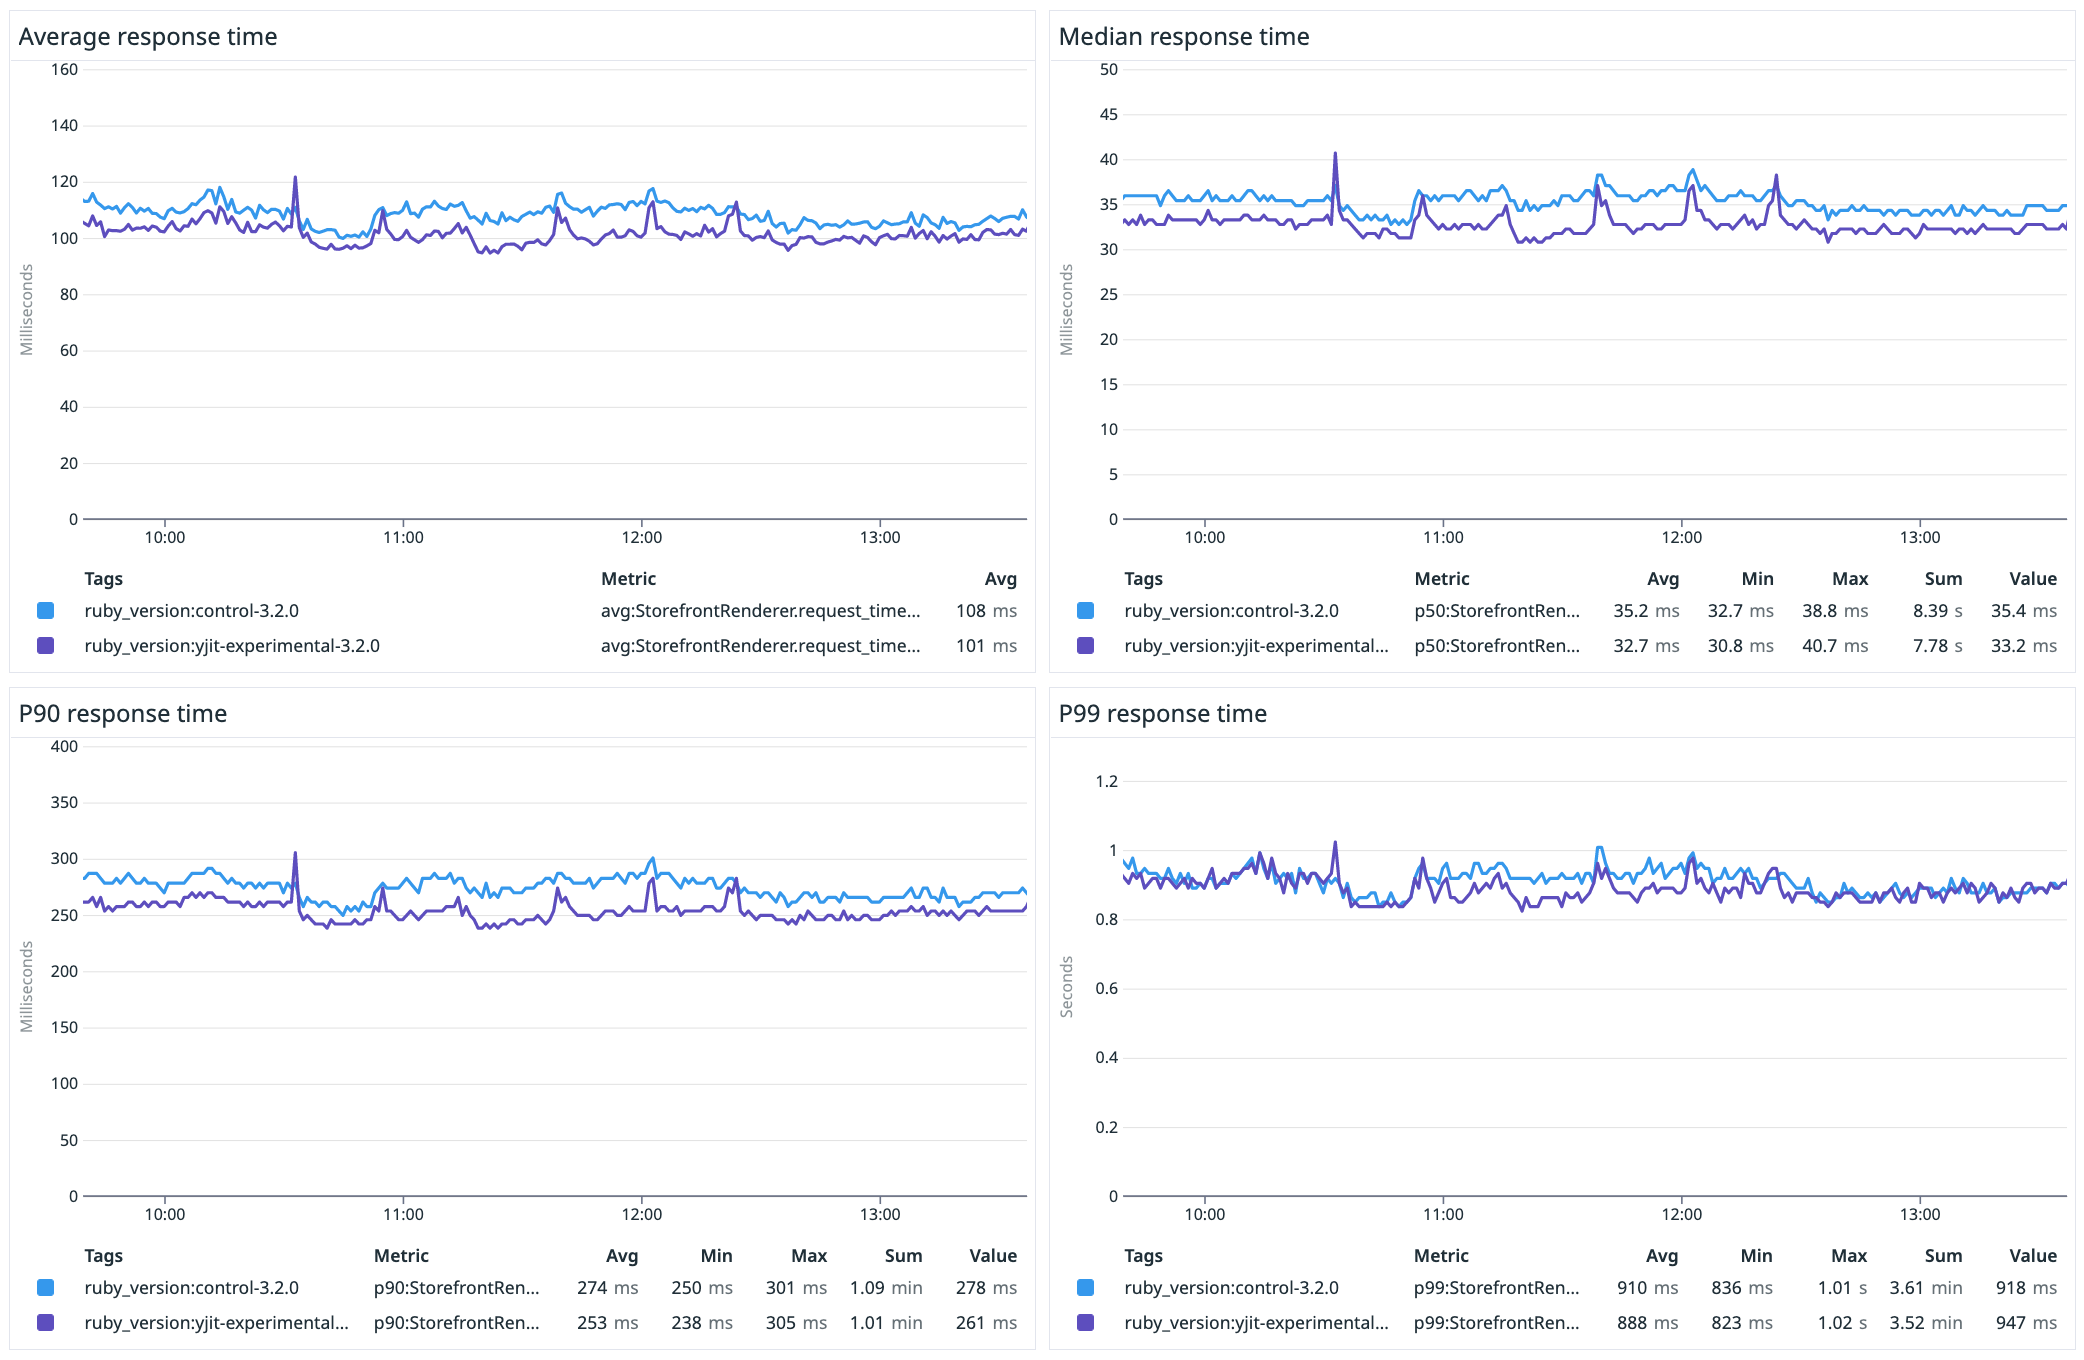
Whether your application is a web server or a worker, it’s generally useful to monitor how long a single operation takes. If it’s a Rails application, you will probably want to monitor the response time taken for each request.
To see the distribution of latency, aggregating the metrics in the following ways gives you good insights:
- Average
- 50% percentile (p50, Median)
- 90% percentile (p90)
- 99% percentile (p99)
YJIT speedup
We’ve seen multiple deployments where people enable YJIT for all workers, and then measure the speedup by comparing the performance before and after the deployment. That could be an unfair comparison because the nature of traffic is likely to be different at different times. For example, at Shopify, the traffic we get depends on the date, time of day, location, and world events (e.g. flash sales).
We evaluate the performance of YJIT by routing a small percentage of our traffic to a YJIT-disabled cluster and comparing it against a YJIT-enabled cluster that receives the same kind of traffic at the same time. This is how we visualized the performance of the interpreter and YJIT in Ruby 3.2.
If you divide the interpreter’s latency by YJIT’s, you can get the speedup ratio as well.
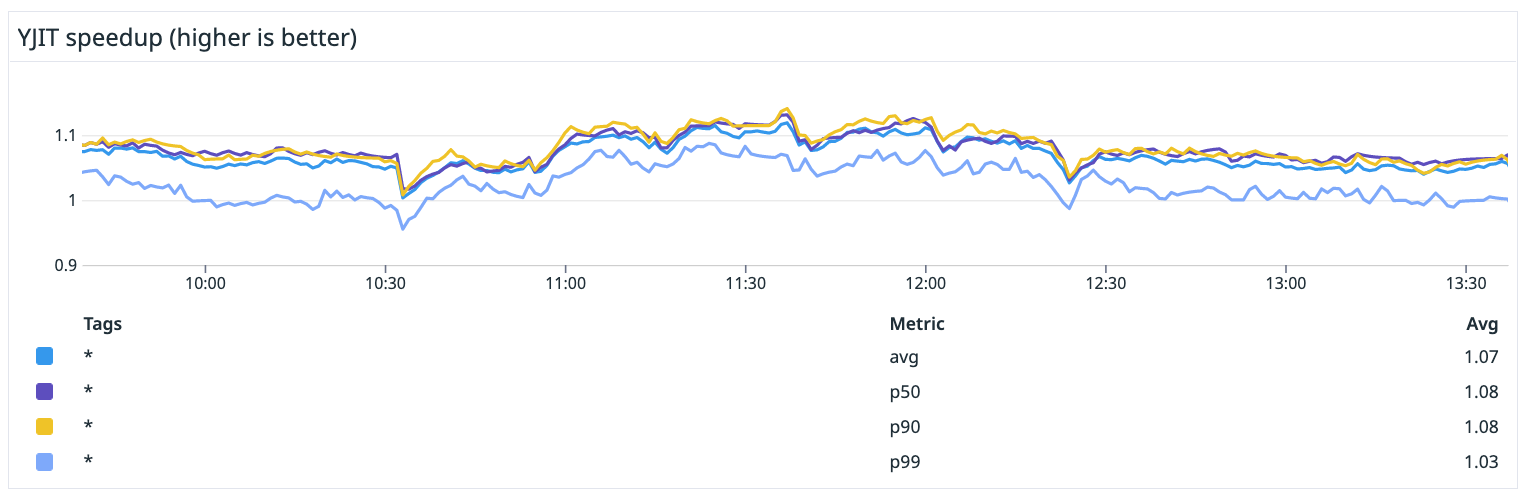
Note that the speedup in this graph was measured with Ruby 3.2. With Ruby 3.3 we’re currently developing, YJIT makes the same application 17% faster on average.
Tracking Errors
If you want to check that your application is behaving well after enabling YJIT, you can check the error rate of your application.
For web servers, the ratio of 5XX status codes are what you want to keep low. Checking 4XXs may be sometimes useful as well. For workers, you could check whether each job raised an exception or not.
To investigate errors and have more insights, you should also use a service to aggregate error reports.
Obtaining YJIT stats
Again, we don’t expect most users to do anything special for monitoring YJIT. But if you want to have more insights into it or investigate performance issues, there are some YJIT metrics that are useful to monitor.
RubyVM::YJIT.runtime_stats
All YJIT metrics are available in a Hash returned by RubyVM::YJIT.runtime_stats.
By default, the Hash looks like this:
$ RUBYOPT=--yjit irb
irb(main)[01:0]> RubyVM::YJIT.runtime_stats
=>
{:inline_code_size=>338600,
 :outlined_code_size=>338428,
 :freed_page_count=>0,
 :freed_code_size=>0,
 :live_page_count=>42,
 :code_gc_count=>0,
 :code_region_size=>688128,
 :object_shape_count=>635}
You can read a field like RubyVM::YJIT.runtime_stats[:code_region_size]
and send the metric to whatever monitoring service you use.
Sampling with a Rack middleware
For a Rack application like Rails, it’s sensible to emit metrics from a Rack middleware in order to isolate the implementation from your application logic.
With a Rack middleware, you could easily apply sampling to minimize the overhead to emit metrics like this:
class YJITStatsMiddleware
  def initialize(app)
    @app = app
  end

  def call(env)
    @app.call(env)
  ensure
    # Sample 1% of all requests
    if RubyVM::YJIT.enabled? && Random.rand(100) == 0
      stats = RubyVM::YJIT.runtime_stats
      # Emit stats to your monitoring service here
    end
  end
end
Stats available in default build
You saw RubyVM::YJIT.runtime_stats returned only 8 fields.
By default, only the metrics that can be generated without adding a runtime overhead are returned.
It returns more metrics if you use --yjit-stats option, and even more if Ruby build options are customized.
First, let’s look at what are available if you normally build Ruby with YJIT enabled.
Note that the Ruby version we use in this article is 3.2.0. Some metrics are missing in Ruby 3.1, and since Ruby 3.2’s YJIT has a much better performance than Ruby 3.1, it’s strongly recommended to upgrade your Ruby version to 3.2 first.
Default stats
The following stats are the ones that are available by default and particularly useful.
Code size
RubyVM::YJIT.runtime_stats[:code_region_size] #=> 720896
From Ruby 3.2, YJIT lazily allocates memory for JIT code in memory pages,
so it may not consume the max size specified by --yjit-exec-mem-size.
It’s incremented in granularity of a page size, which is typically 4KiB on a linux-x86_64 environment for example.
This metric returns the total size of memory pages that have been allocated by YJIT in bytes.
If it’s saturated to the --yjit-exec-mem-size all the time, which is 64MiB by default,
you might want to try increasing --yjit-call-threshold and/or --yjit-exec-mem-size.
See this documentation
for details about these options.
Code GC count
RubyVM::YJIT.runtime_stats[:code_gc_count] #=> 0
Ruby 3.2 added “Code GC” to YJIT.
It’s triggered only when the code size reaches --yjit-exec-mem-size,
so you should see a very small number most of the time, like 0.
Due to its unique design, when Code GC is triggered, it just invalidates all existing code, hoping that the application has been warmed up and you’ll compile less code if you compile only what’s called after that.
So this metric shouldn’t keep increasing.
If it does, you might want to try increasing --yjit-call-threshold and/or --yjit-exec-mem-size.
--yjit-stats
Passing --yjit-stats option enables a lot more metrics that are implemented with extra JIT code.
You probably want to avoid using this option if you want to maximize the speed and minimize the memory consumption.
However, it could be useful if you want to investigate why YJIT is struggling to optimize your application.
Side Exit count
RubyVM::YJIT.runtime_stats[:side_exit_count] #=> 71316
RubyVM::YJIT.runtime_stats[:exec_instruction] #=> 11731800
YJIT supports optimizing Ruby code that we believe are common in production workloads. For other kinds of code, YJIT delegates the execution to the interpreter, which is called “side exits”.
:side_exit_count returns how many times side exits have happened.
On the other hand, :exec_instruction returns the number of Ruby VM instructions that have been executed in YJIT.
If (side_exit_count.to_f / exec_instruction) is too high, e.g. more than 0.2 (20%),
YJIT might not be showing its full potential.
In many cases, it’s the responsibility of the YJIT team to fix it for your workloads in a future version.
It’d be appreciated if you can reproduce the same situation in an open-source repository or a snippet,
but just reporting an entire Hash returned by RubyVM::YJIT.runtime_stats with --yjit-stats
after processing a fair amount of requests might be also useful to let the team prioritize your workloads.
Stats available in stats build
Finally, there are metrics that inevitably add overhead even if you don’t use stats,
which is why those metrics are available only in custom build.
To use them, you need to have Rust’s cargo command as well as rustc in your build environment
and pass --enable-yjit=stats to ./configure for building Ruby.
See this documentation for more details.
Default stats
The following stat is available without passing --yjit-stats to Ruby
as long as you build Ruby with --enable-yjit=stats.
Rust allocations
RubyVM::YJIT.runtime_stats[:yjit_alloc_size] #=> 5444973
Enabling YJIT could increase memory usage more than what you specified with --yjit-exec-mem-size,
which is 64MiB by default. :yjit_alloc_size shows the total size of global allocations
made by YJIT’s Rust code in bytes.
This is useful if you want to check where a memory usage increase comes from when you enable YJIT.
In our production environment, Rust typically uses 2-3x more memory than the JIT code.
So enabling YJIT in our workloads results in increasing the memory usage by 3-4x of :code_region_size in total.
--yjit-stats
In addition to building Ruby with --enable-yjit=stats,
you need to pass --yjit-stats option to Ruby to use the following stat.
Ratio in YJIT
RubyVM::YJIT.runtime_stats[:ratio_in_yjit] #=> 85.35784129553096
(side_exit_count.to_f / exec_instruction) that I showed before doesn’t account for
what happens in non-JITed execution. To see the actual ratio of JITed execution,
you have to also count the number of instructions executed by the interpreter,
which is achieved by this stats build.
:ratio_in_yjit returns the ratio in a percentage. The above example means that
85% of Ruby instructions are executed by JITed code and the remaining 15% was
executed in the interpreter. The larger, the better.
We hope to improve this number in future releases, but as of Ruby 3.2.0, we see about 85% ratio in YJIT in production storefront requests. The same reporting strategy as “Side Exit count” applies to this if you see a lower number than ours in your application.
Conclusion
We don’t expect you to do anything special for monitoring YJIT when you enable YJIT. However, the YJIT metrics explained in this article are useful to get full insights.
More about YJIT
For more information about YJIT, you can check out our documentation or this blog post: Ruby 3.2’s YJIT is Production-Ready.