We Turned Lobste.rs into a Rails Benchmark for YJIT
We’re very proud of how well YJIT, the default JIT in CRuby, optimizes Rails apps. We’ve been using small Rails benchmarks for a couple of years. But as YJIT improves we need more data from real world apps to help us understand what will speed up Ruby the most. We turned the Lobsters codebase into a nice new benchmark. So how did we do that?
YJIT Optimization is Climbing Steps
We create benchmarks and then we work to make YJIT good at them. You can see how YJIT speeds up over time on the same benchmark.
We write benchmarks, we measure benchmarks, and over time we fix YJIT problems that benchmarks show us. Thus does YJIT improve over time.
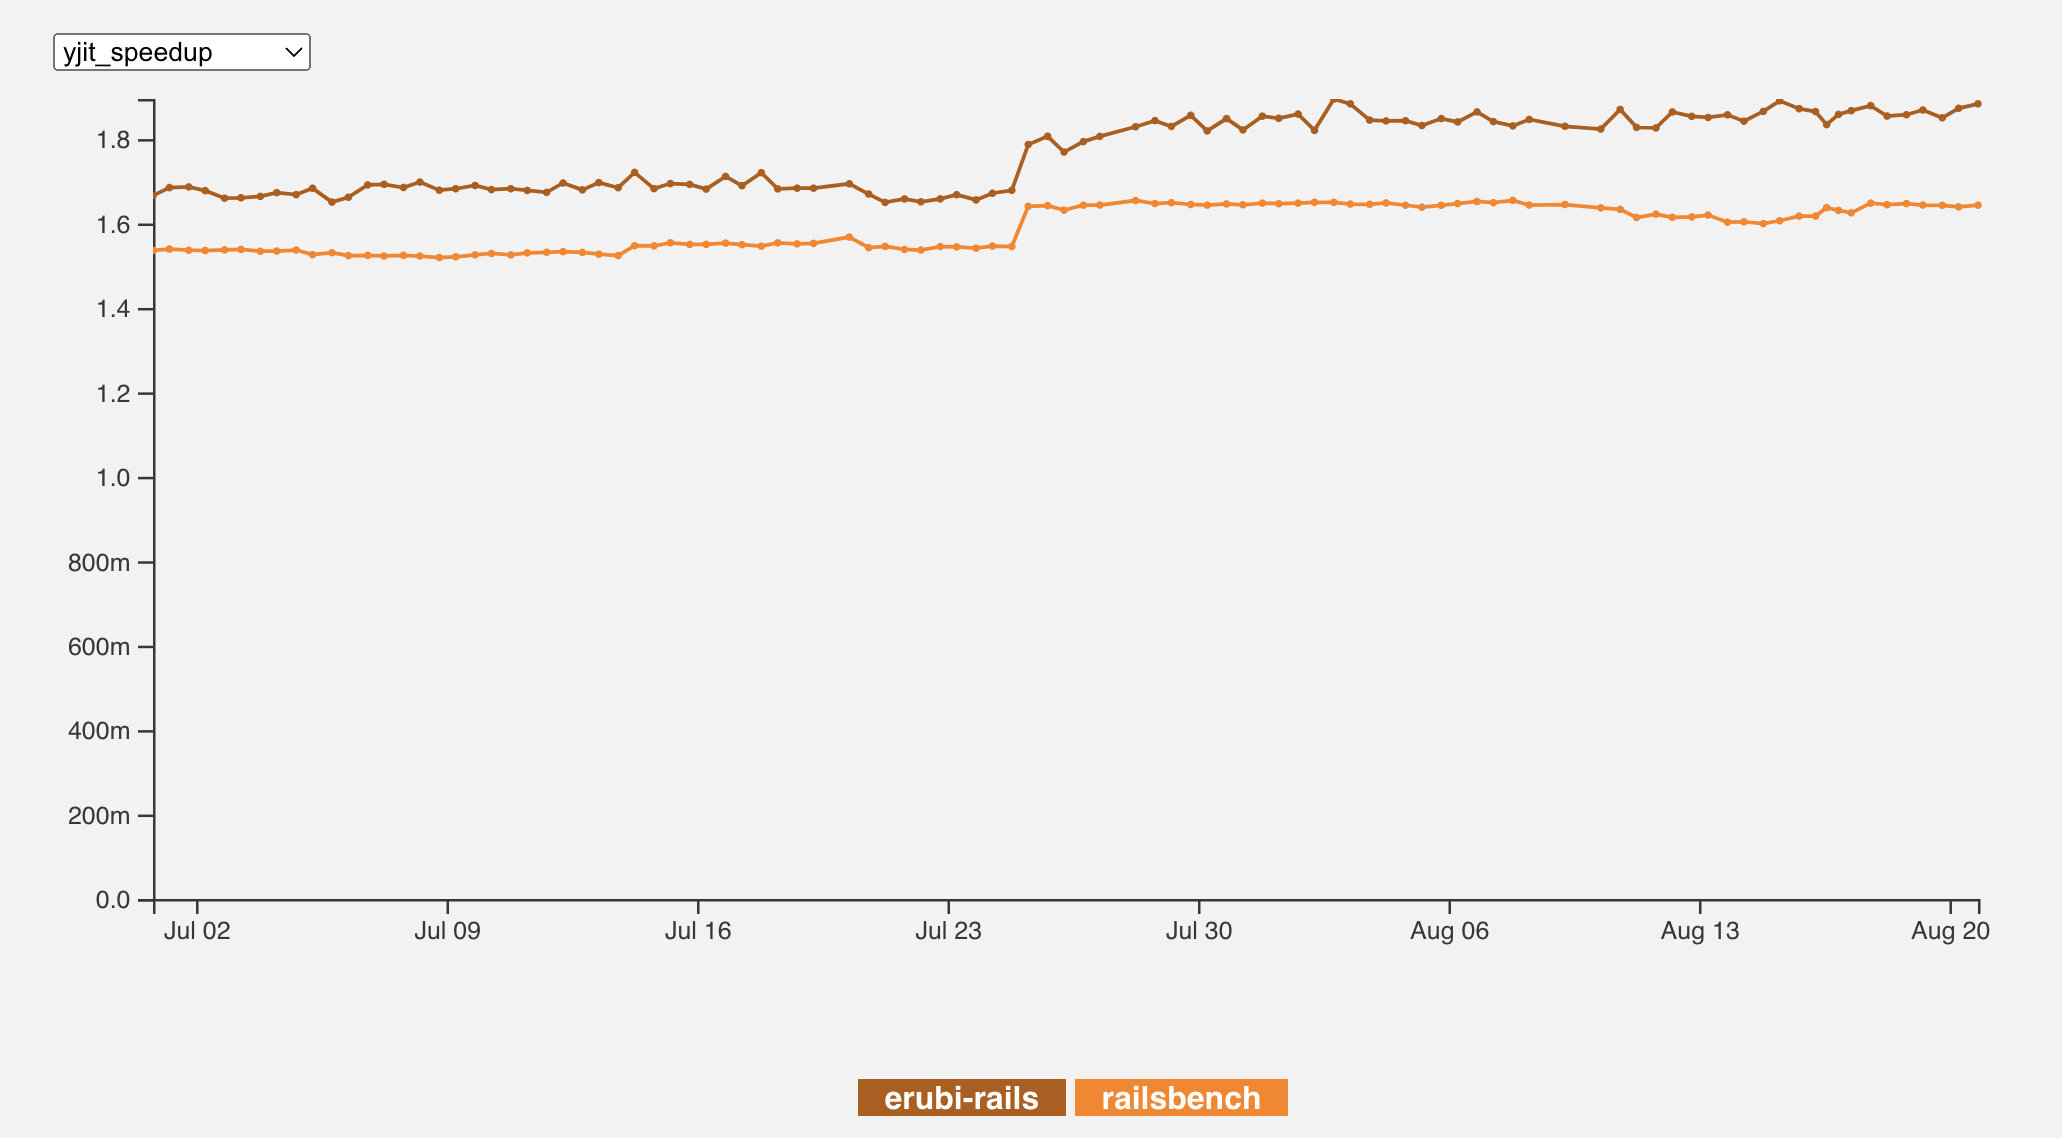
We have benchmarks for little pieces of Rails – Railsbench for a very simple one-resource application, and erubi-rails for testing view rendering in Erubi. They’re both quite small.
As of mid-August, we get about 64% speedup on Railsbench and 83% (!) on erubi-rails. YJIT works pretty well for them.
So we decided to add something bigger and more interesting. But not too interesting. With a gigantic benchmark, it can be hard to tell what’s causing any given trouble, and to understand the results.
Railsbench has about 3,000 compiled ISEQs (Ruby instruction sequences) which can be methods, blocks, procs or similar. And it generates around 5MiB of compiled native code. We wanted something bigger than that. The ISEQ numbers below are a bit smaller because they’re for a single iteration, so not all ISEQs are fully compiled.
| Benchmark | ISEQs | Desc |
|---|---|---|
| psych-load | 64 | Load JSON |
| liquid-render | 146 | Liquid template renderer |
| 30k-ifelse | 9,263 | Many, many if/else statements |
| rubykon | 145 | Go solver |
| erubi-rails | 288 | Erubi template renderer |
| railsbench | 1,359 | Single-resource Rails benchmark |
We looked around for a real-world codebase to start from. Discourse has many dependencies, lots of complexity and very involved setup. It’s a living application and changes frequently. It can be a real pain to keep current – especially when YJIT and Ruby may be changing underneath it. It’s been used for benchmarks, but it can be complex. We’ll eventually want a constantly-running Discourse benchmark, but it’s a pretty audacious target. We decided to start smaller.
Redmine, a Ruby issue tracker, is another decent choice. Like Discourse, folks have benchmarked it before. The code is old and not very clean, but it’s definitely an option.
And Mastodon is a popular choice lately. It runs Rails. It’s widely deployed. It’s trendy. YJIT does work on it. But Mastodon has a lot of dependencies. We’d spend a lot more time making cross-process round trips to PostgreSQL and Redis. We’d likely need some fiddly changes to how it handles setup. Eventually we may need a benchmark like that, but not quite yet.
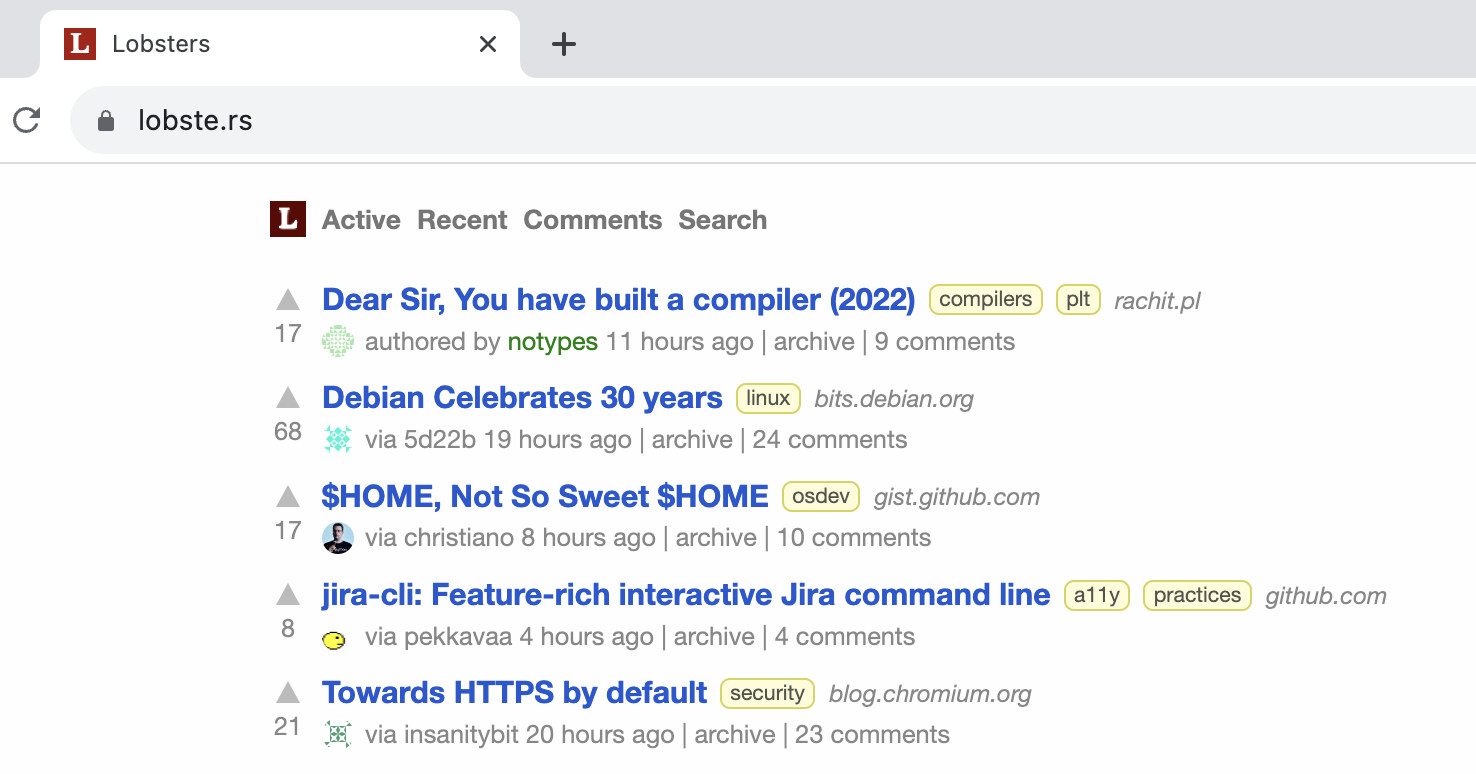
Luckily for us, the code to the https://lobste.rs site is public. It’s a surprisingly neat and tidy little Rails application. It has few dependencies – fewer than you’d think for a Rails app its size, and fewer than you’d expect for a real-world codebase.
What Were We Building?
We knew roughly what size Rails benchmark we wanted. We decided Lobsters looked good. We also wanted a few other things:
A benchmark on edge-Rails – that is, on the very latest, constantly-updated head-of-main Rails code. That way we can watch how we’re doing as Rails changes.
SQLite in-memory mode to reduce database overhead. I thought this was a bit of a stretch goal… and I was wrong. That worked out great with minimal extra work.
Lobsters came with a data-faking utility, which let us set up some data ahead of time. A lot of Ruby operations depend on having some data available, and Active Record is known for burning memory and CPU. So we planned on a decently-sized chunk of fake data. Lobsters made that easy.
We wanted a lot of routes. That way we get a good variety of operations. And right now we’re trying to test YJIT on polymorphic and megamorphic call sites – places where we call the same method, at the same line of the same file, with different types as the receiver of the call. Imagine a debugging method like def whatsit(a); puts a.class, a.inspect; end. You’ll pass a lot of different types as the argument there, and pass lots of different object types as the receiver of inspect on that same exact line. That can be a bit challenging for a JIT. We’re looking for good examples of it happening in real Ruby code. More routes meant more chances at polymorphic calls.
What routes? We tried to use a realistic variety of non-destructive things Lobste.rs does. We did not seriously try to POST, DELETE and change state. Maybe in a follow-up benchmark? It complicates what we’re doing a fair bit. You need to either use a Lobsters admin account or generate requests from a lot of different non-admin accounts.
Some Compromises Between Reality and Benchmarking
A Rails application often has a lot of dependencies – e.g. Postgres, Redis, MemCacheD. For YJIT we don’t care about benchmarking those and we’d rather they not complicate our results. We mostly want Ruby run-time. Luckily, Lobsters has very few dependencies. It uses local files for caching, and turns off most caching when a user is logged in.
We also added an optional check to make sure we weren’t spending too much time in the database layer, which we weren’t.
And the Lobsters code is so straightforward that we could just switch from MySQL to SQLite3 for many (not all) actions, and update some others by hand. For example, the MySQL DATE_FORMAT function converts easily to SQLite’s strftime and MySQL’s NOW() becomes TIME(‘now’). Many of the various conversions aren’t difficult.
And some are quite difficult. Lobsters uses MySQL full-text search. And it searches for similar posts when every post is created, via that full-text search… and we simply commented that out. SQLite has a full-text search extension, but it changes table creation and prevents using a lot of common table operations on any table that uses it. We also turned off the flagged-user check on many actions because the raw SQL queries were hard to port.
But most of it was straightforward. It’s a very clean codebase.
YJIT Optimization is Climbing Steps 2: Too Many Numbers
Skip to the end if you fear numbers.
We can get a lot more detail. If you run a benchmark with --yjit-stats on latest prerelease Ruby (or a stats build of older Ruby), it will tell you what’s going on in great detail. Here’s a chunk of what it prints for a single iteration of Railsbench (not Lobsters!) with everything compiled as soon as it’s run:
***YJIT: Printing YJIT statistics on exit***
method call fallback reasons:
                          block_arg:  1,574,181 (20.3%)
            iseq_has_rest_and_splat:  1,330,270 (17.2%)
                        iseq_zsuper:  1,151,677 (14.9%)
                   iseq_arity_error:    814,576 (10.5%)
                     iseq_has_no_kw:    629,313 ( 8.1%)
                iseq_ruby2_keywords:    619,332 ( 8.0%)
            iseq_materialized_block:    399,942 ( 5.2%)
          args_splat_cfunc_var_args:    398,267 ( 5.1%)
(...)
num_send_polymorphic:     20,653,144 ( 6.3%)
num_send_megamorphic:          7,010 ( 0.0%)
num_send_dynamic:          8,325,671 ( 2.5%)
(...)
compiled_iseq_entry:           1,148
compiled_iseq_count:           2,211
(...)
inline_code_size:          2,784,378
outlined_code_size:        2,407,794
(...)
ratio_in_yjit:                 98.7%
avg_len_in_yjit:                50.3
Top-20 most frequent exit ops (100.0% of exits):
             setlocal_WC_0:    299,563 (41.4%)
               expandarray:    249,225 (34.4%)
                    opt_eq:    124,246 (17.2%)
        getblockparamproxy:     50,402 ( 7.0%)
With this kind of measurement, we can tell that Railsbench is in pretty good shape: nice high ratio in YJIT, relatively few side exits. It’s not an enormous Rails app (around 2,200 compiled ISEQs), but not tiny.
We tend to start with smaller benchmarks, fix the problems in them and then write something bigger. We find problems using statistics, fix many of them, and then move forward to the next thing we don’t (yet) handle well.
As a result, we tend to “stair-step” upward to larger benchmarks. It would be silly to use an enormous benchmark right now because we haven’t fixed small problems that would be obvious with a much smaller benchmark. And it would be silly to write a lot of little benchmarks, because we already optimize them quite well.
It’s a matter of writing “baby bear” benchmarks – not too big, not too small – where there’s a lot of good optimization left to do, but not so large that it’s hard to discover where the problems are.
We also like benchmarks based on real-world code where we can. It’s silly to massively optimize something artificial that nobody uses in the real world.
Here are the same numbers for the new Lobsters benchmark around 15th August:
method call fallback reasons:
                          block_arg:    845,277 (28.4%)
                iseq_ruby2_keywords:    561,031 (18.8%)
                    args_splat_ivar:    260,416 ( 8.7%)
                     iseq_has_no_kw:    221,739 ( 7.4%)
                           kw_splat:    206,605 ( 6.9%)
                    iseq_has_kwrest:    187,831 ( 6.3%)
           iseq_missing_optional_kw:    156,542 ( 5.3%)
(...)
num_send_polymorphic:     72,296,189 (29.6%)
num_send_megamorphic:        144,178 ( 0.1%)
num_send_dynamic:          3,540,203 ( 1.5%)
(...)
compiled_iseq_entry:           3,011
compiled_iseq_count:           5,242
(...)
inline_code_size:          8,606,101
outlined_code_size:        7,270,385
(...)
ratio_in_yjit:                 98.4%
avg_len_in_yjit:                58.9
Top-20 most frequent exit ops (100.0% of exits):
                opt_getconstant_path:    224,084 (53.4%)
                              opt_eq:     63,771 (15.2%)
                  getblockparamproxy:     58,508 (13.9%)
                       setlocal_WC_0:     52,487 (12.5%)
At this point it’s basically the same percentage of its instructions in YJIT as Railsbench. We expected that to be lower. Originally it was lower. But once we started working on the benchmark, the team started optimising it. Still, getting it that close, that fast, means it’s not that much less tractable.
The Lobsters benchmark is much larger, about 3,000 compiled ISEQs rather than around 1,100. And the code size is larger, around 16MiB rather than about 5MiB. There’s a nice higher percentage (around 30%) polymorphic sends, indicating that it’s using its method calls with a variety of different types of objects being passed around. That’s important to handle well for Rails applications.
The End, Past the Big Blocks of Numbers
(Just a few more numbers, but they’re pretty friendly.)
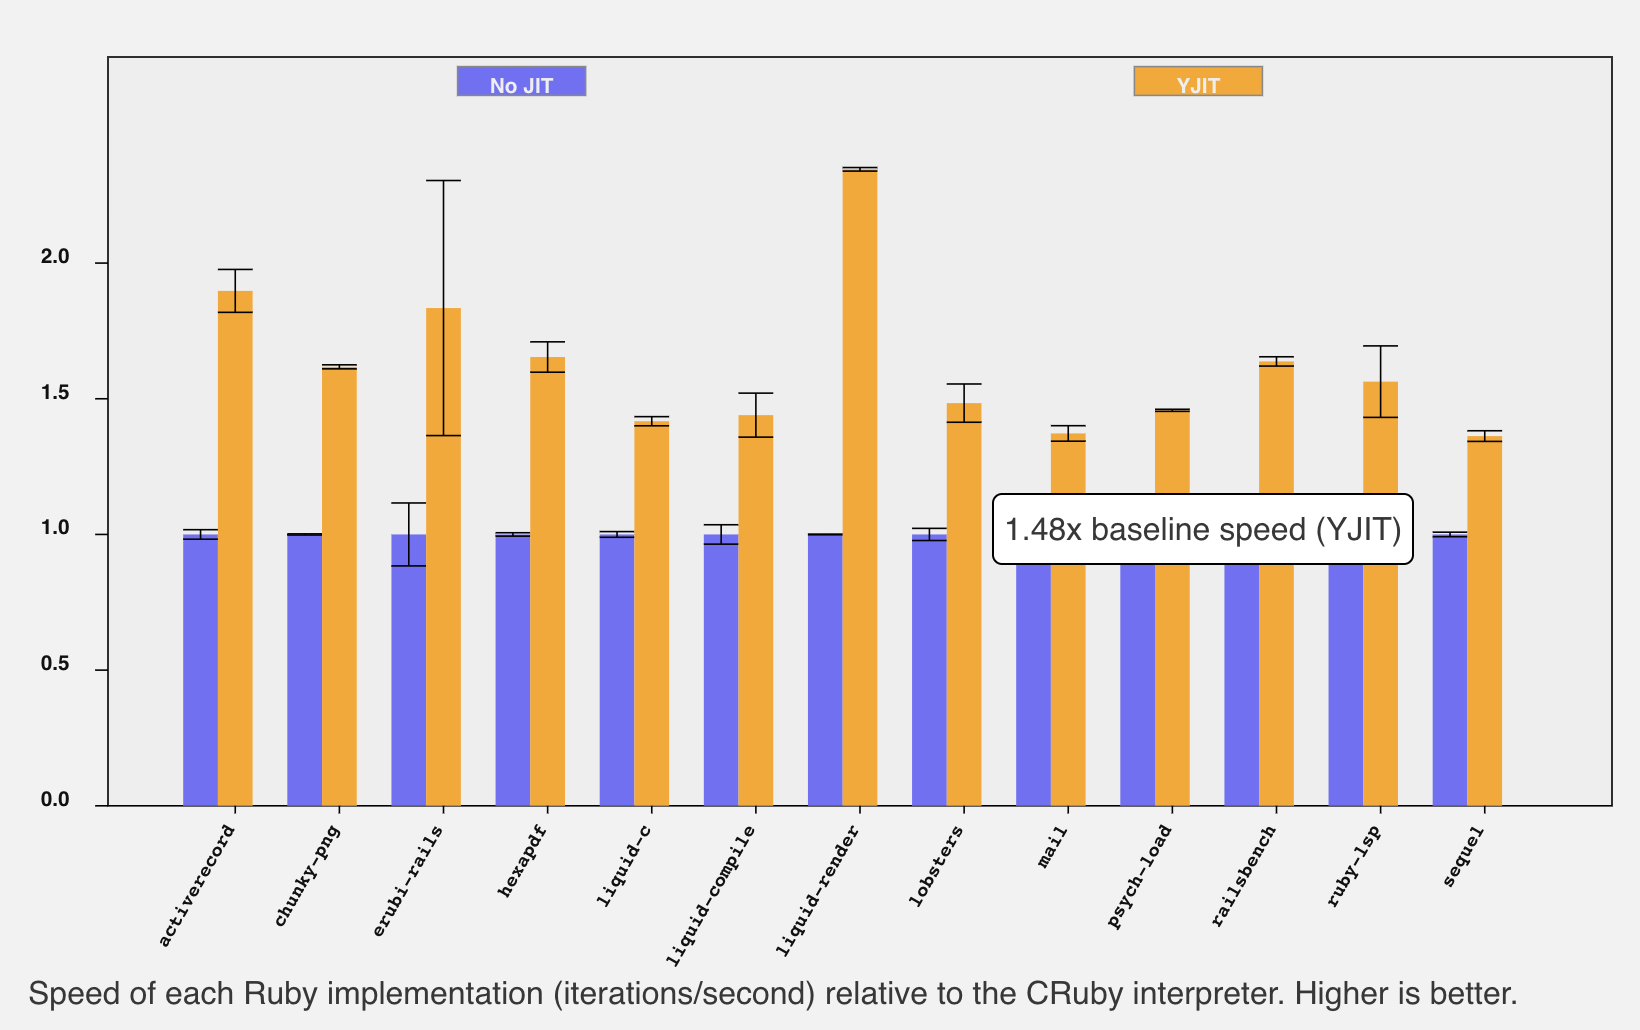
So how did we do? We got a 48% initial speedup for the Lobsters benchmark. That’s in the sweet spot - not so high we have nothing to improve, but not so low that we’d have to make major architectural changes to do anything useful. Around three times the size of Railsbench for ISEQs and compiled code. That’s nice! And far more Rails routes than any other yjit-bench benchmark. Let’s call it 24 routes, if we ignore very similar ones. And 98.7% of the instructions ran entirely in YJIT. That’s pretty high, maybe even a little bit too high. I guess we’ll need to write something more challenging next time!