

ZJIT is now as fast as YJIT
After some infrastructure deployment shenanigans, we deployed some regions of storefront renderer (SFR) running on ZJIT. We have seen some promising numbers.
Get in losers, we’re going benchmarking
ZJIT is our new SSA-based method JIT compiler for Ruby. We’ve been working on it and blogging about it for a year and a half and recently deployed it to production.
I’m going to share some screenshots from our internal Grafana instance and use them to draw some very exciting preliminary conclusions about ZJIT.
First, ZJIT is probably as fast as or faster than YJIT. Here is a 24-hour chart of request response time comparing YJIT and ZJIT. YJIT is the green line and ZJIT is the yellow line.
If you look closely, you can see there’s a gap between YJIT and ZJIT, where ZJIT sits lower, and lower is better! It seems like we can serve requests a little faster than YJIT. Exciting stuff. The absolute numbers on the Y-axis have been redacted.
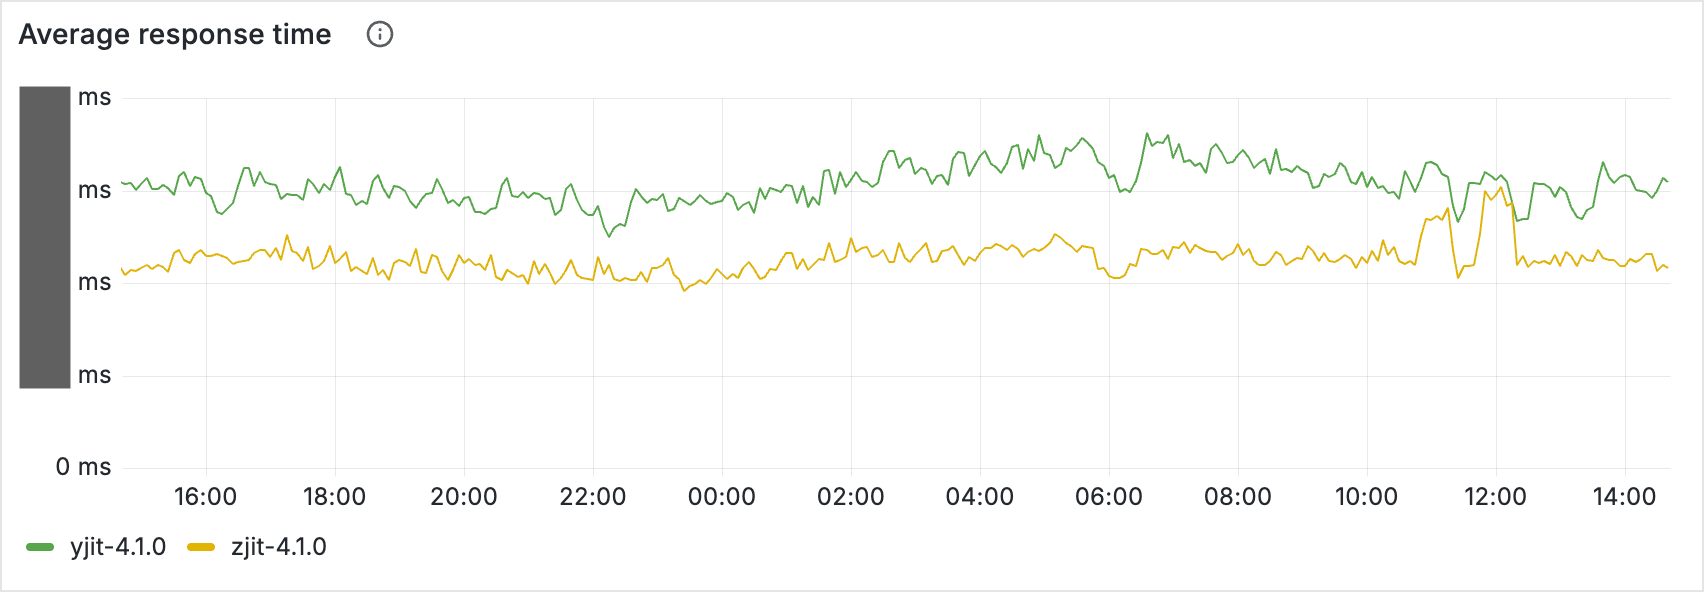
Is this 24h going to be the same as the next 24h? What if there is some seasonality thing going on where we accidentally have not optimized Weekend Code? I don’t know. We’ll continue to monitor it.
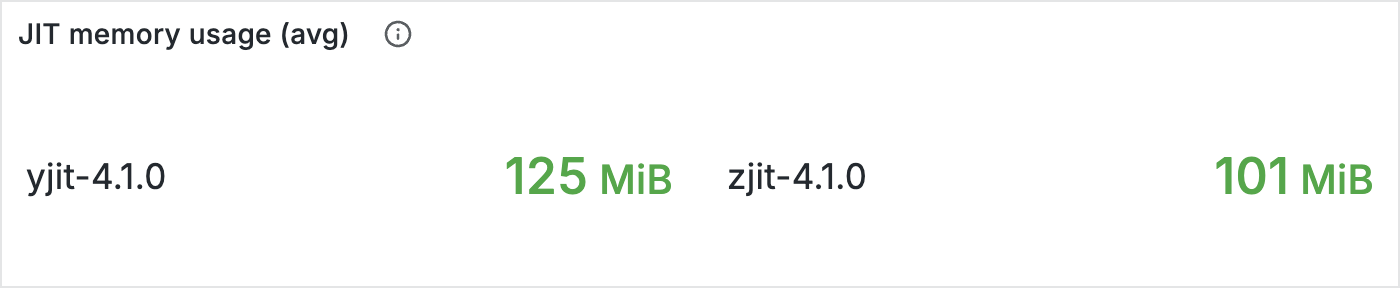
Second, ZJIT uses less memory than YJIT. Here is a side-by-side of average JIT memory usage for the processes running YJIT and the processes running ZJIT. There’s other stuff in there like the Ruby heap: this is just the JIT memory overhead.
We constrain our JIT memory usage two ways:
- by limiting the size of the code region and
- by limiting the size of the metadata region.
So total_size = min(code_size, 48MiB) + min(metadata_size, 80MiB), ish.
Because YJIT stores contexts for its lazy basic block versioning (LBBV), it keeps JIT type information more or less indefinitely. ZJIT, by contrast, keeps smaller interpreter type profiles and then only keeps compiler-internal type information alive for a millisecond or so while it is compiling the method.
That said, we have a lot of room to further shrink ZJIT memory usage: we generate more code (less precise than LBBV and more versions) and probably bigger code.
Third, and somewhat harder to measure, ZJIT compile time is not a deal breaker. We don’t have exact stats here but the general warmup curve for ZJIT does not look much different from YJIT and the steady-state compile time is also similar. Unfortunately I do not have a good picture for this one.
Caveats
Of course, there are some caveats here. Take this very big and fuzzy benchmark with a grain of salt.
Small region
Out of an abundance of caution, especially as we approach Black Friday/Cyber Monday, we are running ZJIT only on a couple small regions in the world. Also, these small regions are only running ZJIT, meaning we’re comparing against YJIT in a different small region with a similar volume of traffic. That makes the comparison a little sketchy.
This is one benchmark
ZJIT might also be faster on your benchmark (nice!) or it might be slower (aw man). SFR is a pretty general chunk of Ruby code—calls, data movement, I/O—and we have been working on optimizations that help benchmarks that look like this. For example, we have found that the lobste.rs benchmark is a useful proxy; optimizing it helps SFR, and is easier to benchmark than SFR. This work has also helped benchmarks such as the new grape benchmark, which we were not even tracking until it popped up on /r/ruby.
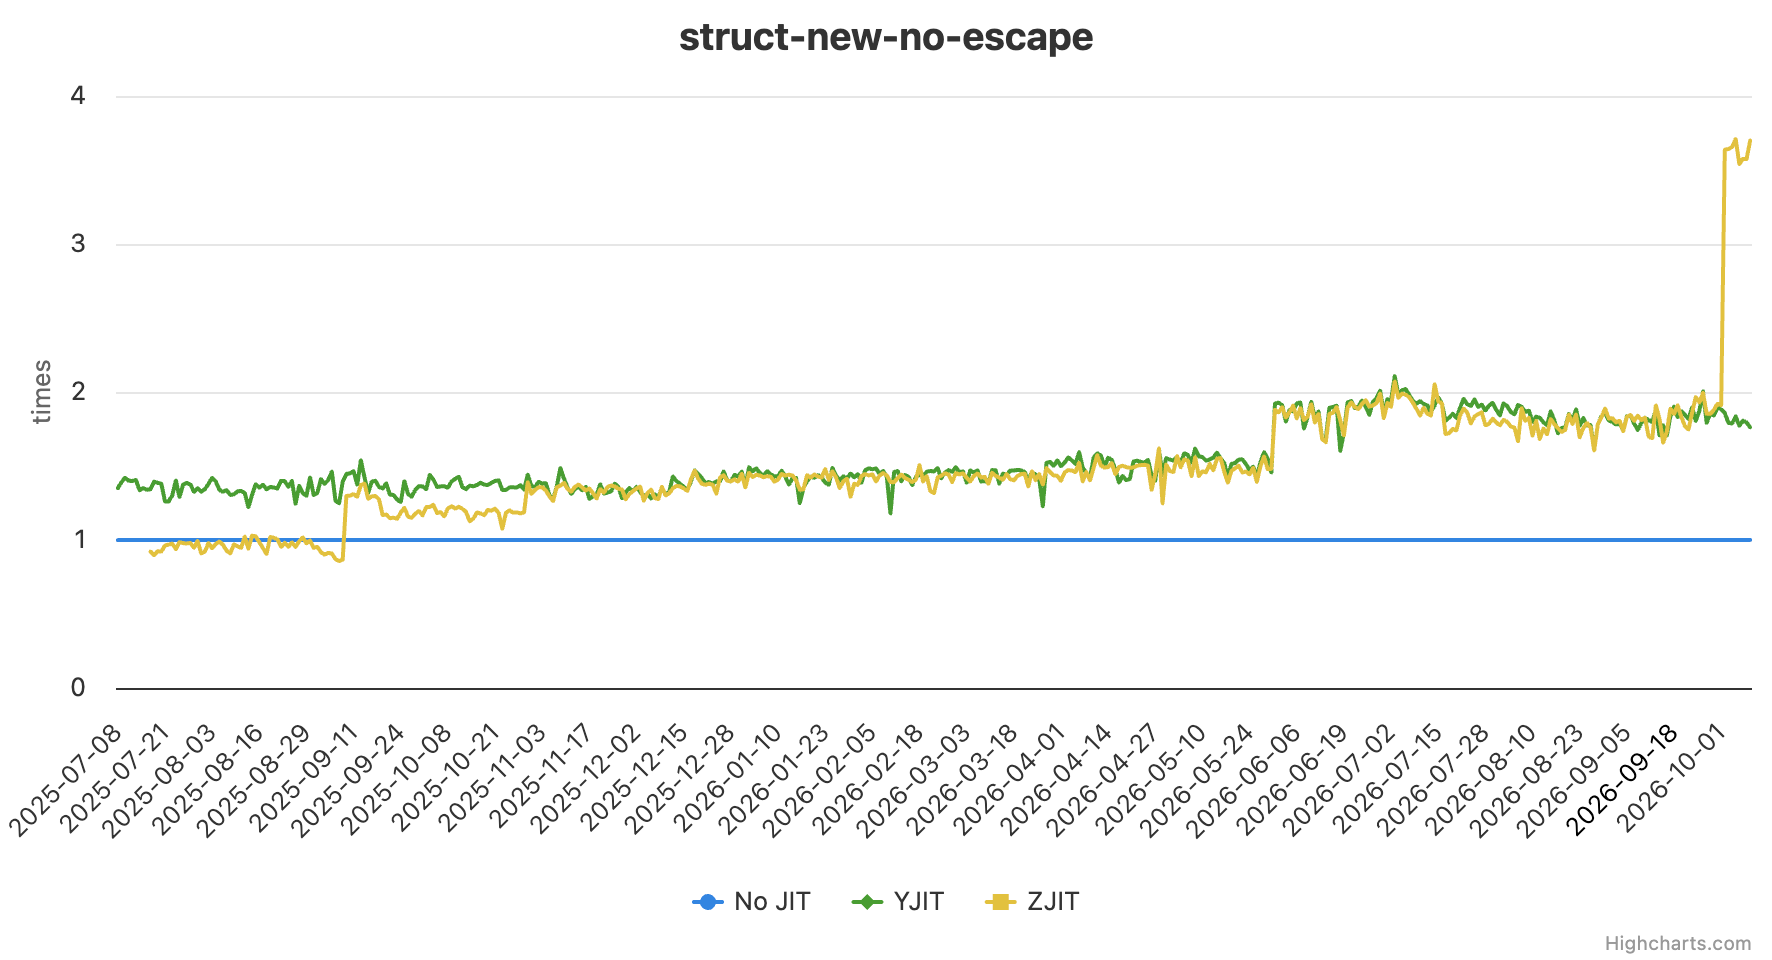
Some of our benchmarks gradually get faster over time because we improve the
compiler. For example, this benchmark of Struct improved a lot recently
because we optimized the allocation and initialization of Struct objects.
This gave more information to the optimizer so another pre-existing
optimization (load-store elimination) could do even better.
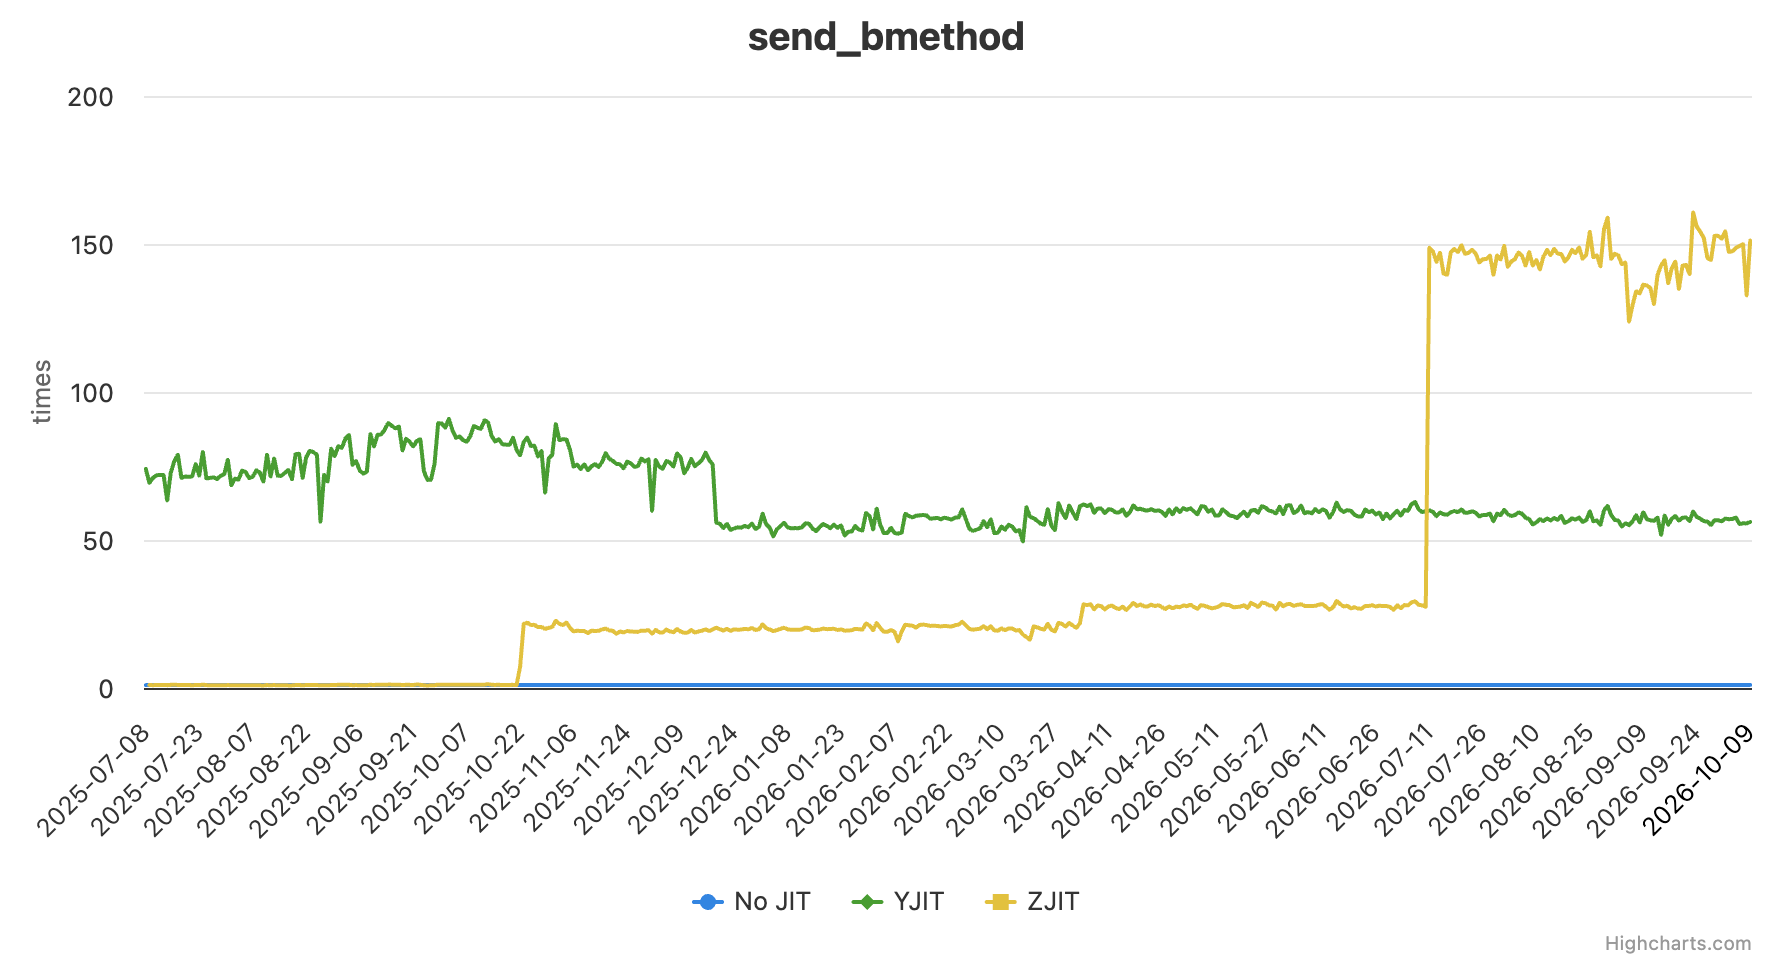
Other benchmarks stop making sense. ZJIT deletes the majority of this bmethod benchmark, for example. We originally were benchmarking the call path but now there is no call and everything is inlined. Weird!
We also track some other benchmarks which don’t look nearly as good. For a lot of benchmarks, we are neck and neck with YJIT. And there are definitely some where we are worse.
There are some very complex calling convention features we don’t support yet. We don’t have a great approach to exception handlers right now. That sort of thing.
And if your benchmark is a really heavy numerics benchmark, ZJIT probably won’t look much better than YJIT or other JITs; we have not put in the effort to optimize floating point operations. We don’t even have support for them in our backend yet!
This is the best benchmark run of your life so far
We do not intend to stop here. There is so much juice left to squeeze.
Among our current projects are:
- “Adaptive compilation” or “function lifecycle”, which is about creating knobs and tuning when we profile, compile, exit to the interpreter, and re-compile code. We have some primitive heuristics here and I think we have a lot to learn from decades of research in other runtimes.
- More whole-method optimizations. We are currently working on making our memory load-store elimination method-global instead of block-local, which will delete many more loads and stores. We can do similar stuff with other optimization passes using our instruction effects API.
- As you might have been able to tell from our recent academic paper, local variables (PDF)
Future projects may include:
- Code GC. We currently have an append-only region of machine code and once we hit the limit we don’t compile anymore. Bummer! A bunch of code is probably called a lot and compiled in warmup and then rarely called thereafter, so we should be able to re-use that memory.
- Inlining blocks. We can inline
Array#each, for example, into its caller, and specialize the call to the block, but we do not yet support inlining the blocks themselves. Making this work would turn anArray#eachinto a normalwhileloop with no programmer effort! - Rewriting C builtins in Ruby. ZJIT can only reason about Ruby code so calls
to complex built-in C functions such as
Range#eachare completely un-optimizable. We intend to re-write a good deal of these in Ruby so that they can be optimized by the JITs. - Making inline frames cheaper. We inline code but still do a lot of fake frame push metadata movement where the call and return used to be. We are slowly breaking this down to (hopefully, in the end) no overhead at all.
- Allocation removal / partial escape analysis. The generational hypothesis is
that most GC-allocated objects are allocated and then “die” (nothing points
to it) very soon thereafter. With any luck, ZJIT can observe the allocation
point and all of an object’s uses in the same compilation unit and remove the
allocation completely. This is helpful for
Hash#each_pair, for example, which allocates a bunch of short-lived arrays that people immediately unpack. Or*args. Or other stuff… - Exception handlers. Right now we delegate a lot of
begin/rescueandbreak/next-in-block to the interpreter. This is a bummer; we should be able to handle it at least somewhat efficiently in the JIT. It’s a big project and we’re still thinking about how we want to do this. - More precise alias analysis. This will let us remove more memory loads and stores if we can prove that there is less potential for object field overlap.
- We have plans to further reduce compile time, potentially even beating YJIT in the future. We shall see!
Try it out
You can mess around with our intermediate representation viewer on tryzjit.
You can also run ZJIT locally! While Ruby now ships with ZJIT compiled into the
binary by default, it is not enabled by default at run-time. If you want to
run your test suite with ZJIT to see what happens, you absolutely can. Enable
it by passing the --zjit flag or the RUBY_ZJIT_ENABLE environment variable
or calling RubyVM::ZJIT.enable after starting your application.
We recommend trying it out on your application and reporting bugs—performance, behavior, or otherwise—on Redmine or on GitHub.
We’re also excited to talk about ZJIT. We have had several interested people reach out, learn about ZJIT, and successfully land complex changes. For this reason, we have opened up a chat room to discuss and improve ZJIT. We recommend asking about specific issues before diving in and trying to fix them yourself. It’s generally not obvious what to work on or how to work on it.
Happy Friday, everyone.