
YJIT Is the Most Memory-Efficient Ruby JIT
This year, the YJIT team and I have gotten a paper accepted at MPLR 2023 (Managed Programming Languages and Runtimes), which is now freely available through ACM open access. The paper, titled “Evaluating YJIT’s Performance in a Production Context: A Pragmatic Approach”, goes into details of the strategy taken to evaluate YJIT’s performance in a production context. One of our key findings, when comparing YJIT against other existing Ruby JITs such as JRuby and TruffleRuby, is that YJIT is the most memory-efficient Ruby JIT (by a long shot).
A video recording of our presentation at MPLR is also available on YouTube.
Background
Many published papers about JIT compilers only look at peak performance in terms of running time on benchmarks after a certain amount of warm-up time. This can be deceptive because the amount of time needed for a JIT compiler to warm up can be arbitrarily long. Typically, the JIT compiler implementation is given as many benchmark iterations as it needs to reach peak performance, and the peak performance as measured then is reported. The amount of time needed to reach peak performance is often not discussed. The same goes for memory usage.
I believe that those metrics are typically ignored by academic compiler researchers because they may reveal an inconvenient reality. If you give your JIT compiler an arbitrary amount of time and memory to reach peak performance, it’s easier to throw all possible known optimizations at a piece of code and reach high peak performance numbers. However, if your JIT compiler uses an arbitrarily high amount of memory and needs a very long time to warm up, even though it may have the fastest peak performance, it may be unusable in most real-world production environments.
When deploying code into production, peak performance is not the only thing that matters. On our production servers at Shopify, there is not a huge amount of memory available for the JIT compiler to use. Almost all of the memory is used to run multiple server processes, and also to cache various resources in RAM. This has forced us to spend a significant amount of effort on optimizing YJIT’s memory usage to make the compiler more resource-efficient.
At Shopify, we deploy frequently, with consecutive deployments sometimes less than 20 minutes apart. This adds an extra layer of challenge because, despite these frequent deployments, we can’t tolerate significant increases in response time. If a JIT compiler needs a significant amount of time to warm up, or suddenly deoptimizes large amounts of code, this can translate into requests timing out, and customers abandoning their shopping carts, which ultimately would result in lost revenue. As such, smooth, predictable warm-up and stable performance are of critical importance.
Methodology
In our paper, we look at YJIT’s warm-up, memory usage and peak performance on benchmarks, as well as on our deployment on Shopify’s StoreFront Renderer (SFR). For context, SFR renders all Shopify storefronts, which is the first thing buyers see when they navigate to a store hosted by Shopify. It is mostly written in Ruby, depends on over 220 Ruby gems, renders over 4.5 million Shopify stores in over 175 countries, and is served by multiple clusters distributed worldwide. It is capable of serving over 1.27 million requests per second, and has processed over 197 billion USD in transaction volume in 2022. YJIT is currently deployed to all SFR servers. For this paper, we’ve performed experiments using Ruby head on a subset of servers in all clusters. We’ve also included some control servers which ran the same Ruby commit without YJIT. Data for the SFR experiments was gathered over a 48-hour period.
For our experiments on benchmarks, we used 11 headline benchmarks from the
yjit-bench suite. These are all benchmarks that are based on real-world Ruby gems,
with a bias towards web workloads. This includes benchmarks such as railsbench,
hexapdf, activerecord and liquid-render, which is a benchmark using Shopify’s liquid
template language gem.
We benchmarked YJIT, RJIT (Takashi Kokubun’s experimental Ruby JIT written
in Ruby), JRuby, as well as both the JVM and native versions of TruffleRuby.
More details on our experimental setup
are provided in the paper.
We also maintain a website, speed.yjit.org, which tracks YJIT’s performance and memory overhead as well as various other statistics on this benchmark suite over time. Recently, as we were looking for more challenging and realistic benchmarks, we’ve also turned the codebase of the lobste.rs website into a benchmark as well.
Key Findings
Performance on Benchmarks
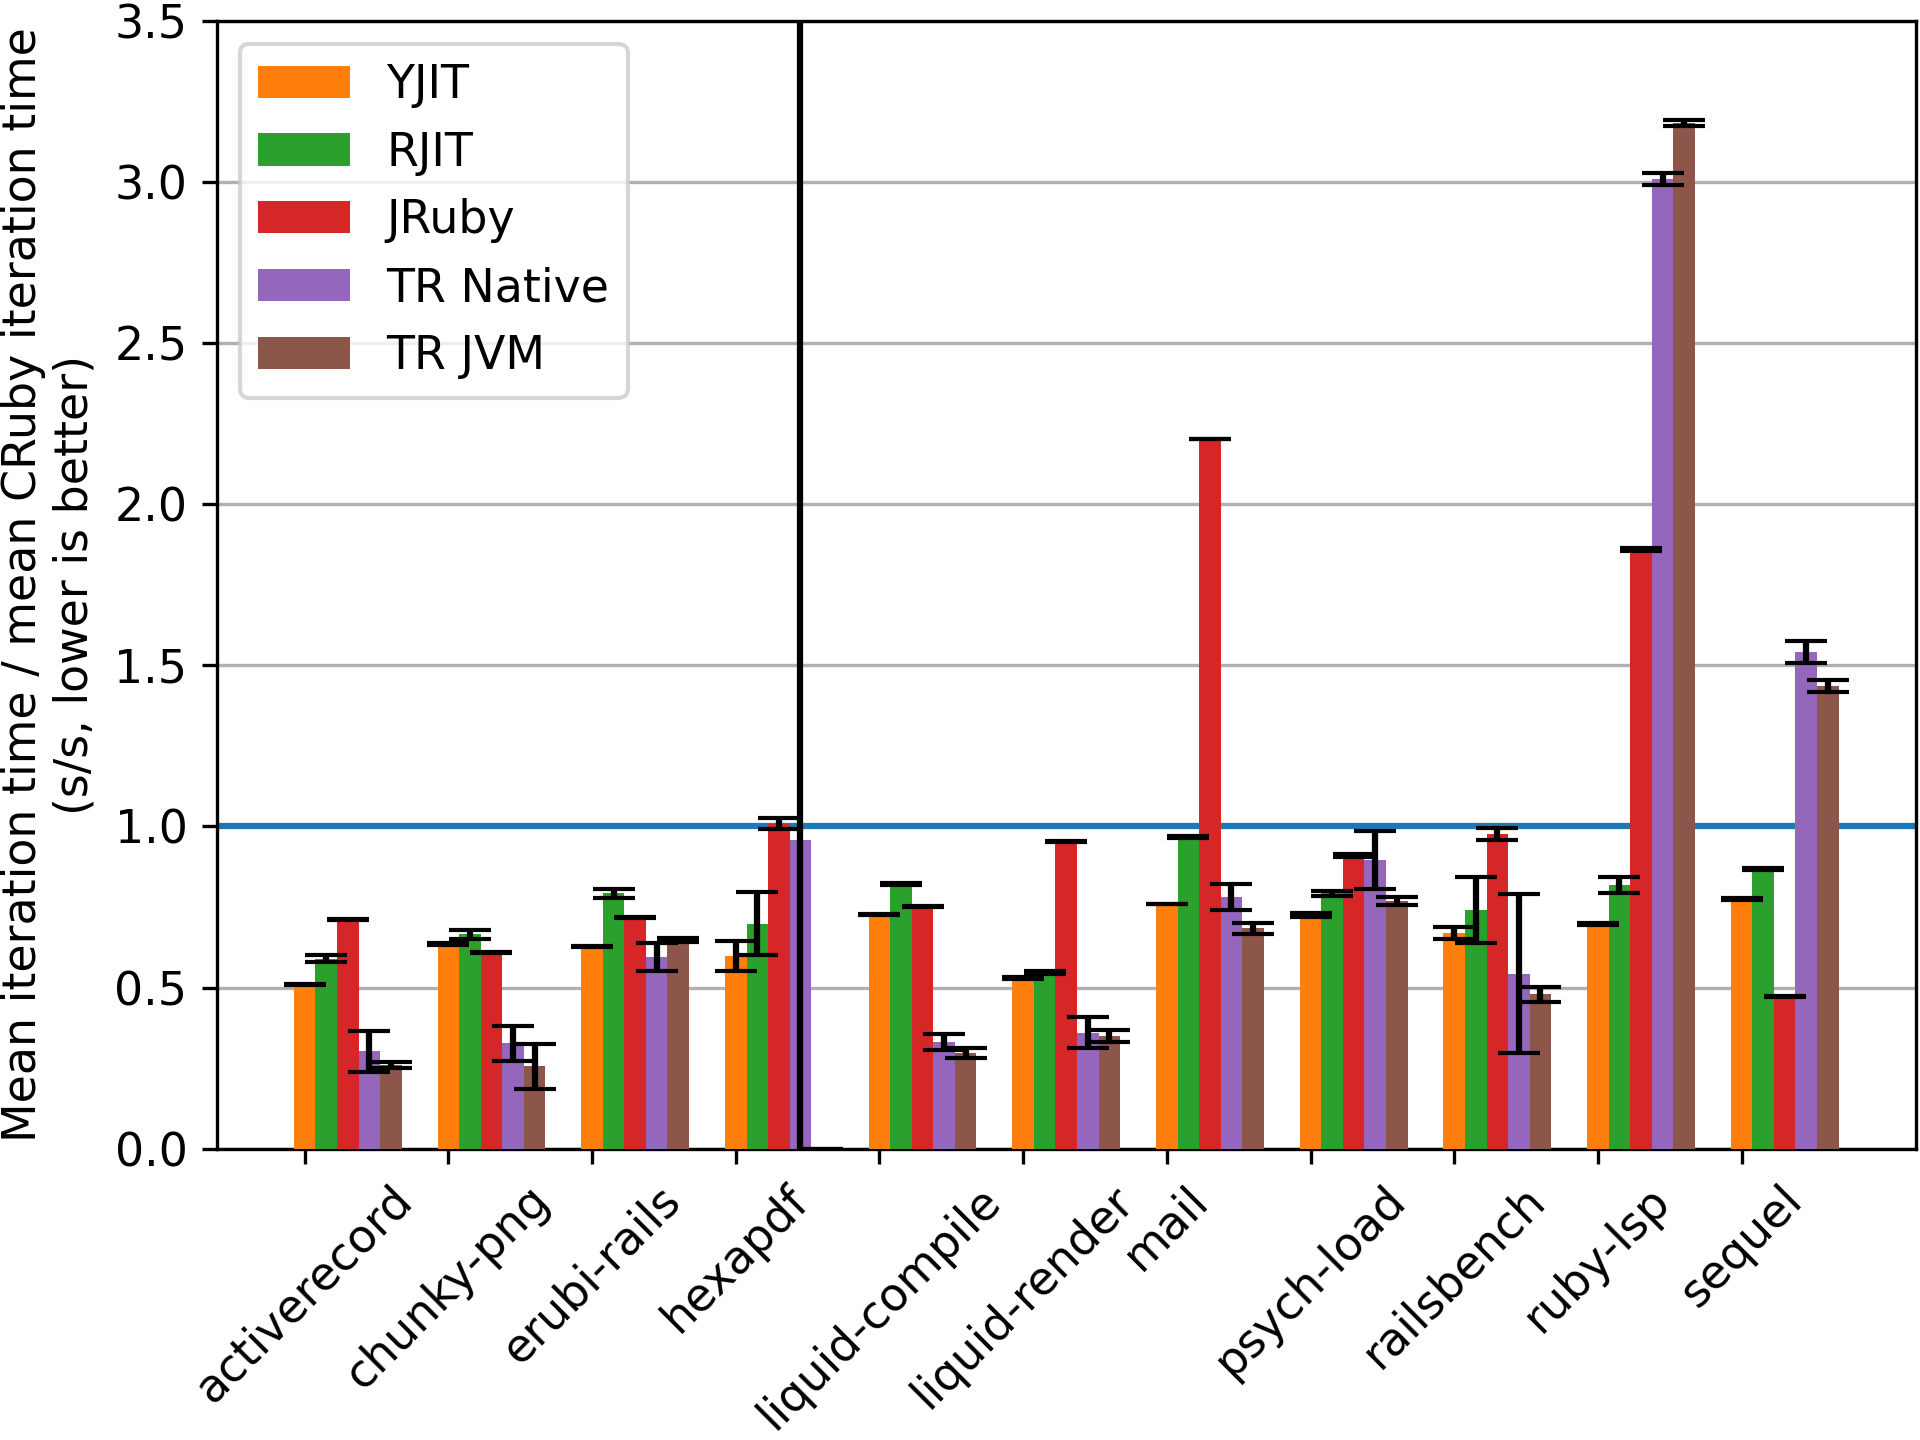
The above graph shows the average execution time on each benchmark for each of the Ruby JIT implementations we benchmarked. The time is normalized to the time taken by the CRuby interpreter, where the time taken by the interpreter has value 1.0, with values below 1 being faster than the interpreter. We were very generous in terms of warm-up time. Each benchmark was run for 1000 iterations, and the first half of all the iterations were discarded as warm-up time, giving each JIT a more than fair chance to reach peak performance.
As can be seen, TruffleRuby has the best peak performance on most (but not all) benchmarks. YJIT outperforms the CRuby interpreter on every benchmark by a wide margin. We can also see that YJIT performs very competitively compared to JRuby (a JVM-based Ruby JIT), outperforming it on most benchmarks.
Warm-Up Time on Benchmarks
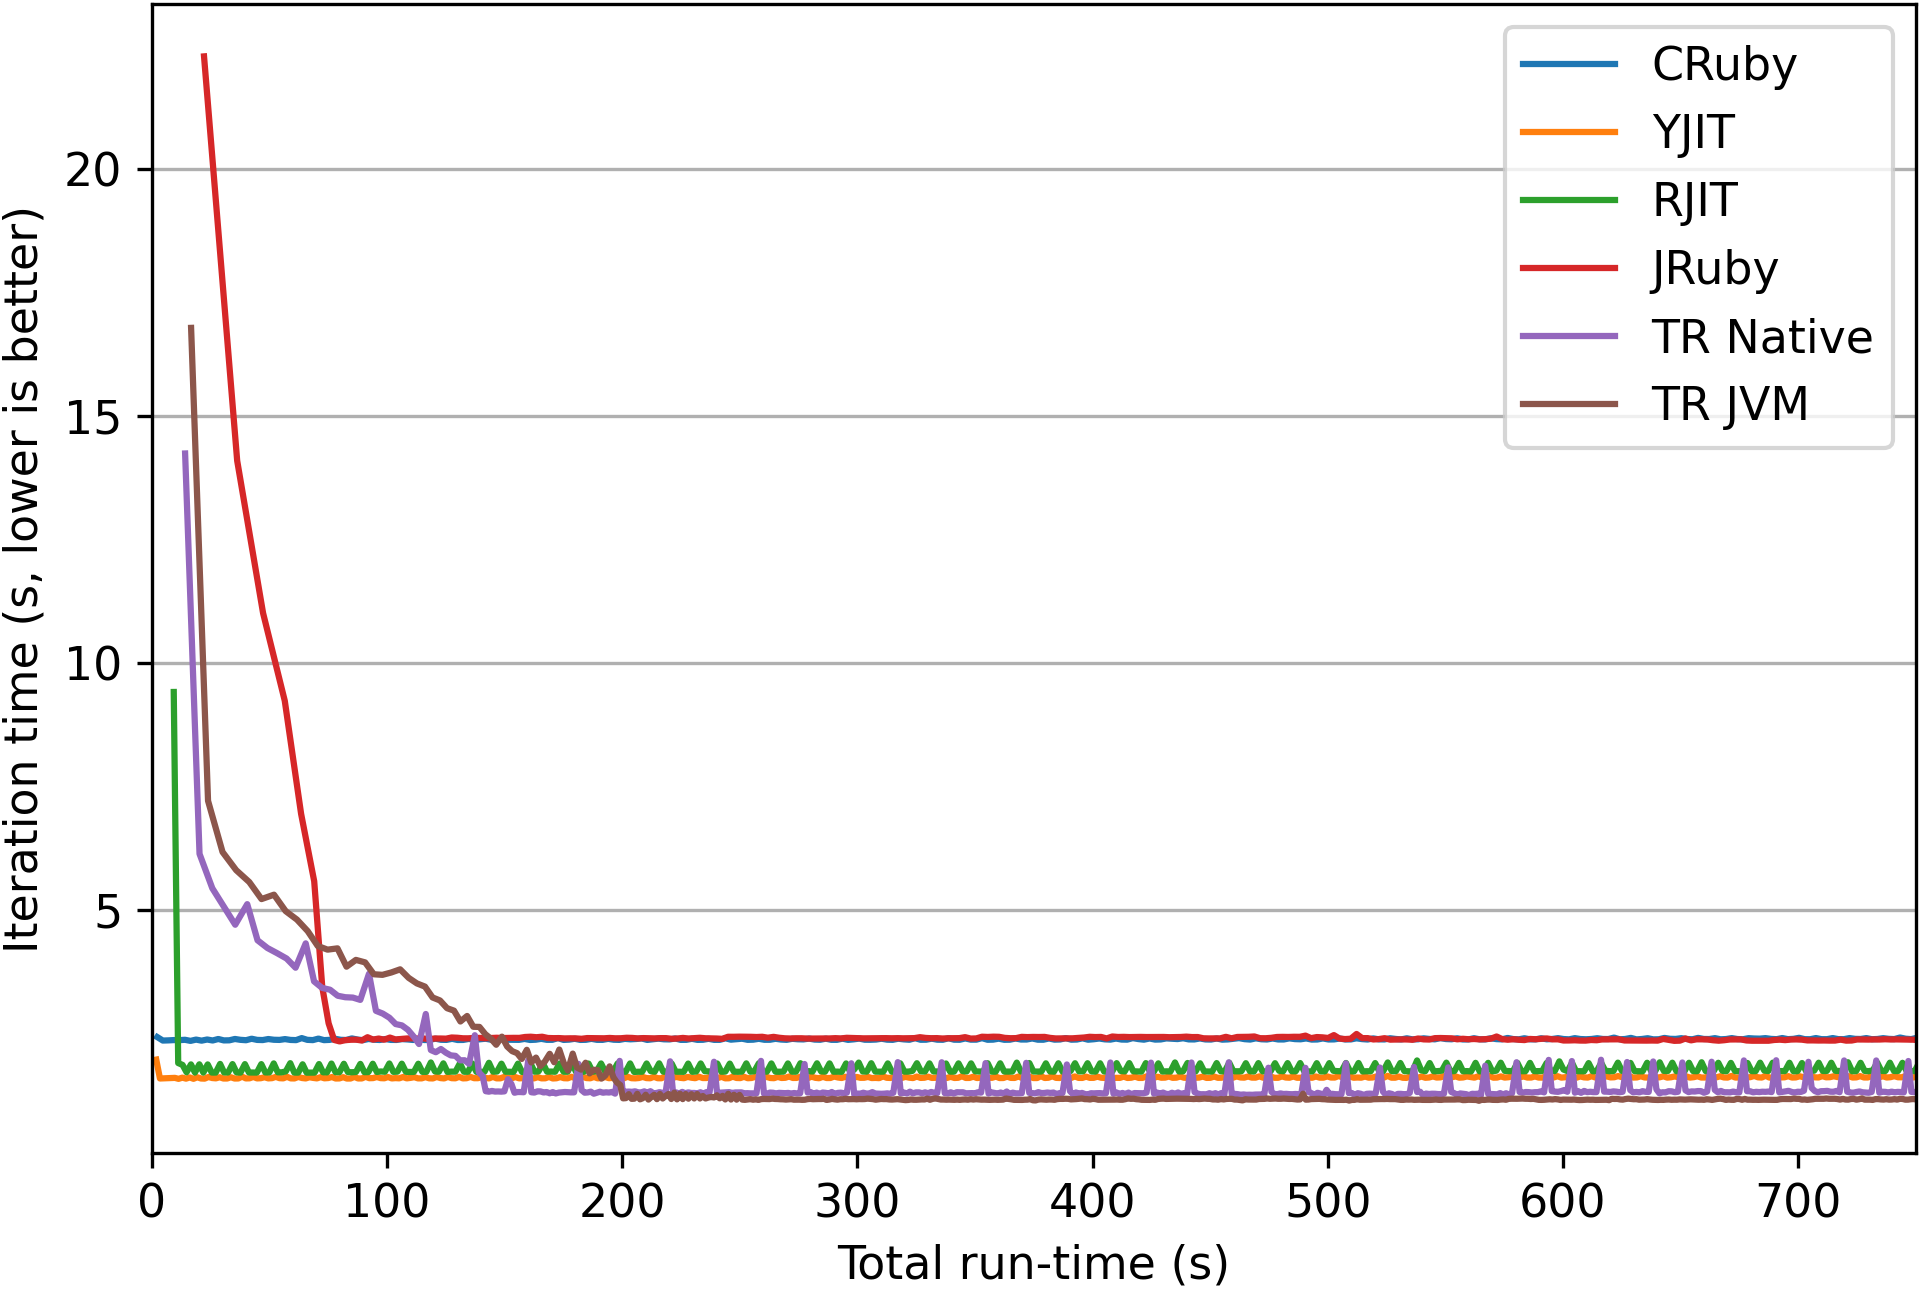
This graph shows a plot of the performance over time for each Ruby JIT for the railsbench benchmark.
The x-axis is the total execution time in seconds, while the y-axis is the time per benchmark iteration. This
allows us to visualize how the performance of each VM evolves over time. As can be seen, YJIT
almost immediately outperforms the CRuby interpreter, with RJIT not too far behind. JRuby takes over a
minute to reach peak performance, but does not reliably outperform CRuby on this benchmark.
TruffleRuby eventually outperforms the other JITs, but it takes about two minutes to do so. It is
also initially quite a bit slower than the CRuby interpreter, taking over 110
seconds to catch up to the interpreter’s speed. This would be
problematic in a production context such as Shopify’s, because it can lead to much slower
response times for some customers, which could translate into lost business. Such wide variations
in performance can also make the scaling of server resources more difficult. We should also note
that while railsbench is a somewhat challenging benchmark, it is much smaller than our actual
production deployment. Warm-up data for other benchmarks is provided in the paper.
Memory Usage on Benchmarks
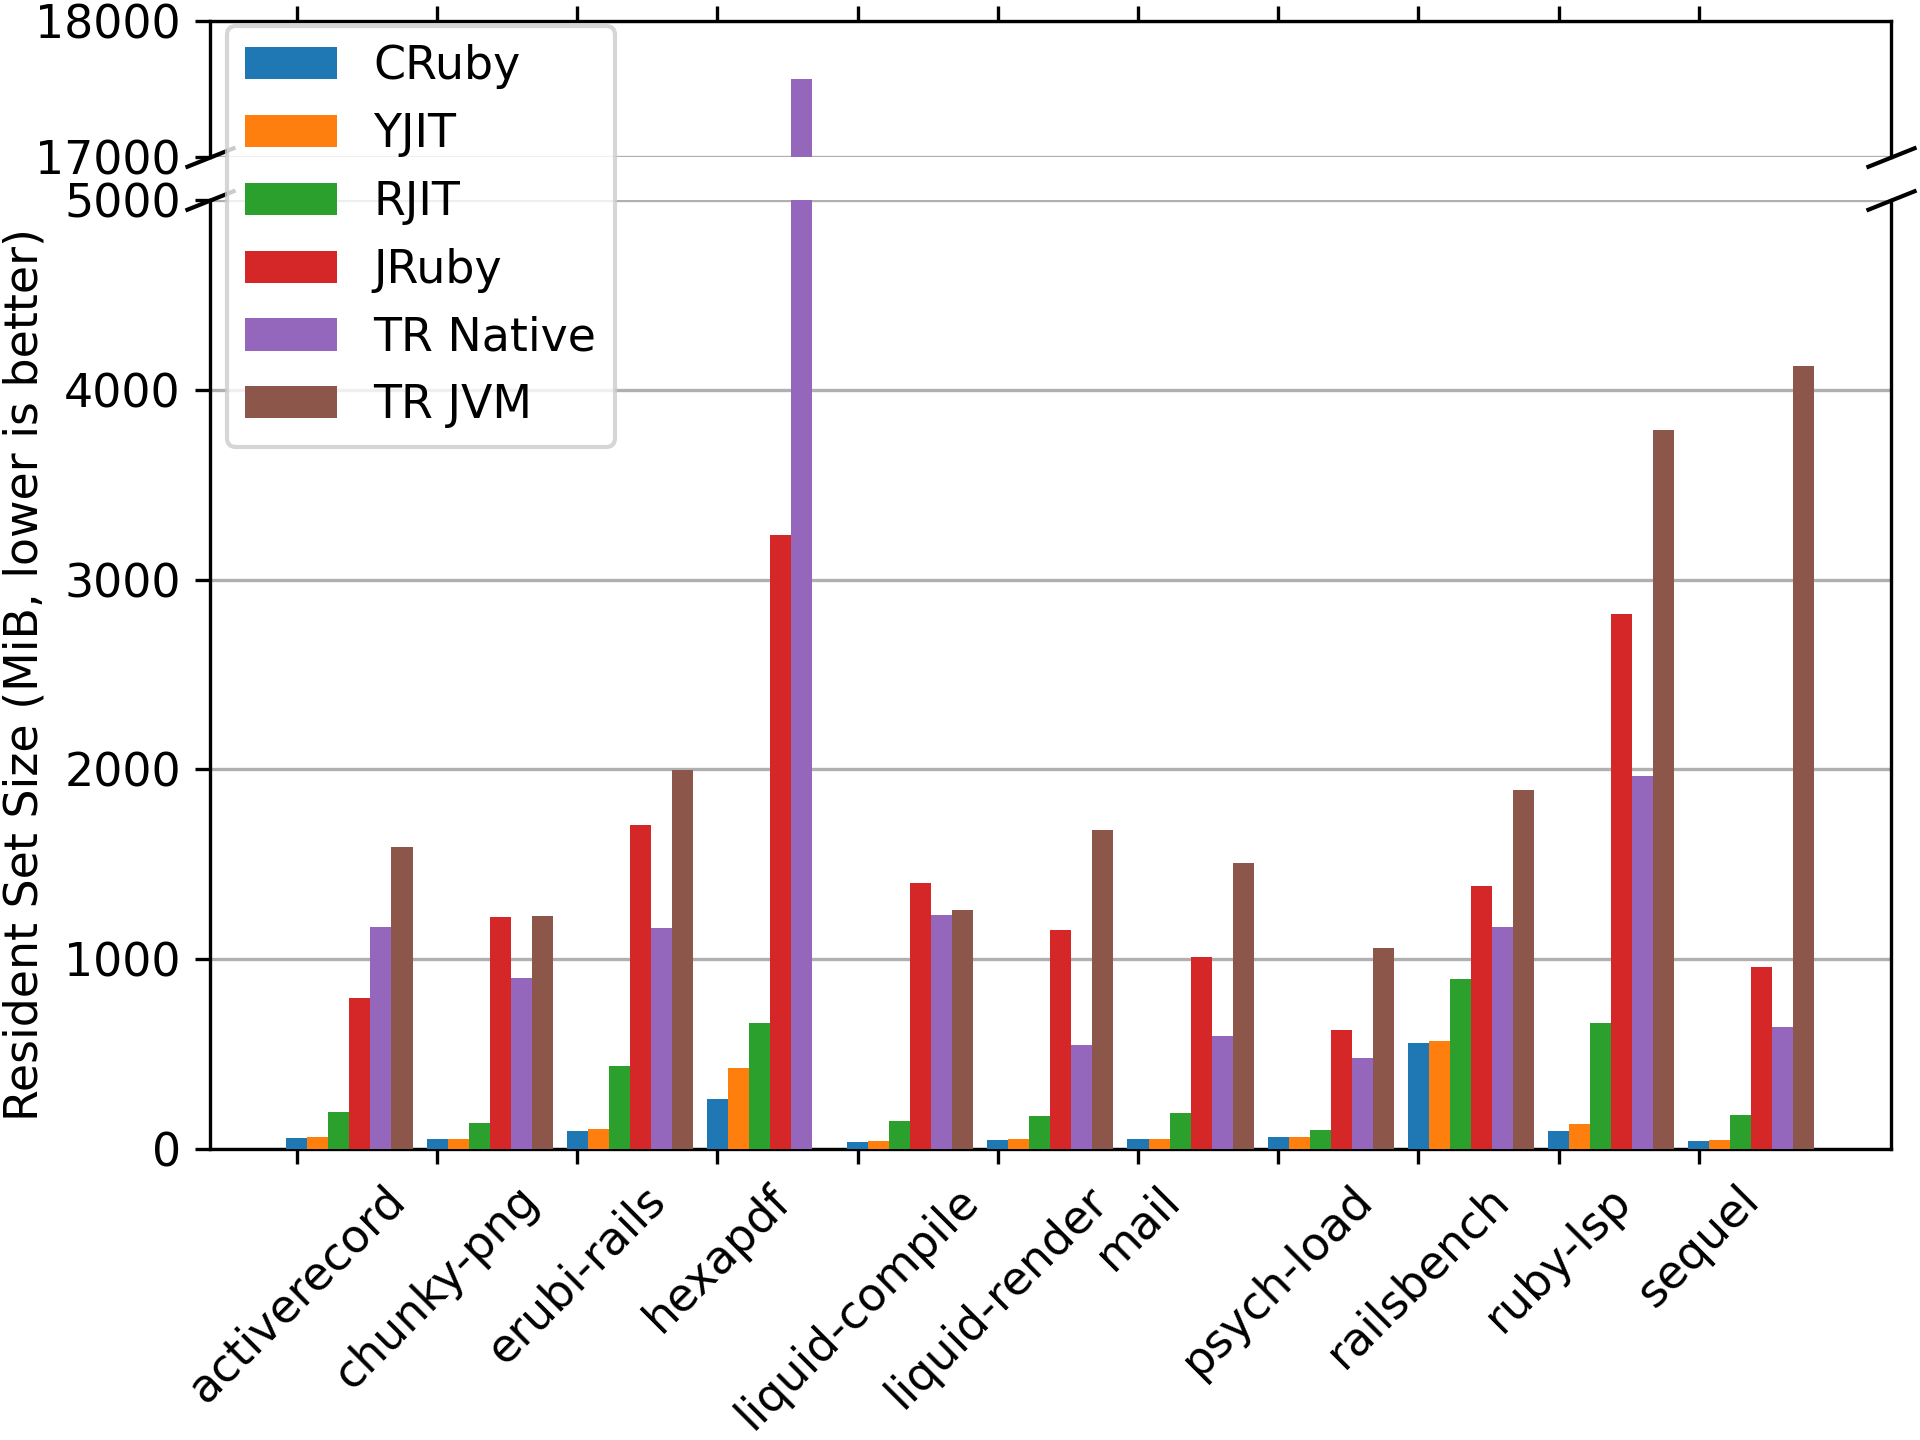

As can be seen in the graph above, thanks in large part to the work put in by our team to optimize its memory overhead, YJIT has the lowest memory overhead of any Ruby JIT by far. The JVM-based Ruby implementations often use one or even two orders of magnitude more memory than YJIT and the CRuby interpreter. The memory overhead compared to CRuby can be as much as several gigabytes. This is on benchmarks that often require less than 100MiB to run with the CRuby interpreter, which makes such a high amount of memory overhead seem disproportionate.
One significant caveat here is that we are measuring the total memory usage of each system. That is, the memory overhead of the JVM itself has an impact. The way that JRuby and TruffleRuby internally represent Ruby objects in memory, which is different from the way CRuby represents objects in memory, also has an impact. However, the bottom line is the same. Using several gigabytes more memory than CRuby to run simple benchmarks likely bodes poorly for many production deployments. For smaller production deployments, for example, a project running on inexpensive Virtual Private Servers (VPS), there may be only 1GiB or 2GiB of RAM available in total. For a company like Shopify running a large fleet of servers, the amount of server processes that can be run on a single machine, and how much memory can be used for caching matters.
There is another caveat, which is that JRuby and TruffleRuby, unlike CRuby, do not use a GVL
(Global VM Lock, analogous to Python’s GIL). In theory, this means that they can more effectively
use multithreading, and amortize some of their memory overhead across multiple server threads.
Still, there is a case to be made that the memory overhead of JRuby and TruffleRuby is something
that is often overlooked and probably should be better optimized.
Aside from production deployments, the ruby-lsp benchmark is a benchmark of the Ruby language
server, which can be used by code editors such as VSCode.
We can see that on this benchmark, the JVM-based Ruby implementations can use multiple gigabytes
of memory, and despite that, perform worse than the CRuby interpreter. This is far from ideal
for a Ruby gem that is meant to be run on developer laptops.
I would also like to note that RJIT, Takashi Kokubun’s experimental pure Ruby JIT, looks quite good in this comparison. However, in the previous graph, the inclusion of the JVM-based Ruby JITs distorts the sense of scale. The next graph below shows the same memory usage comparison, but with only CRuby, YJIT and RJIT included. Currently, there are situations where RJIT uses several times more memory than CRuby and YJIT:
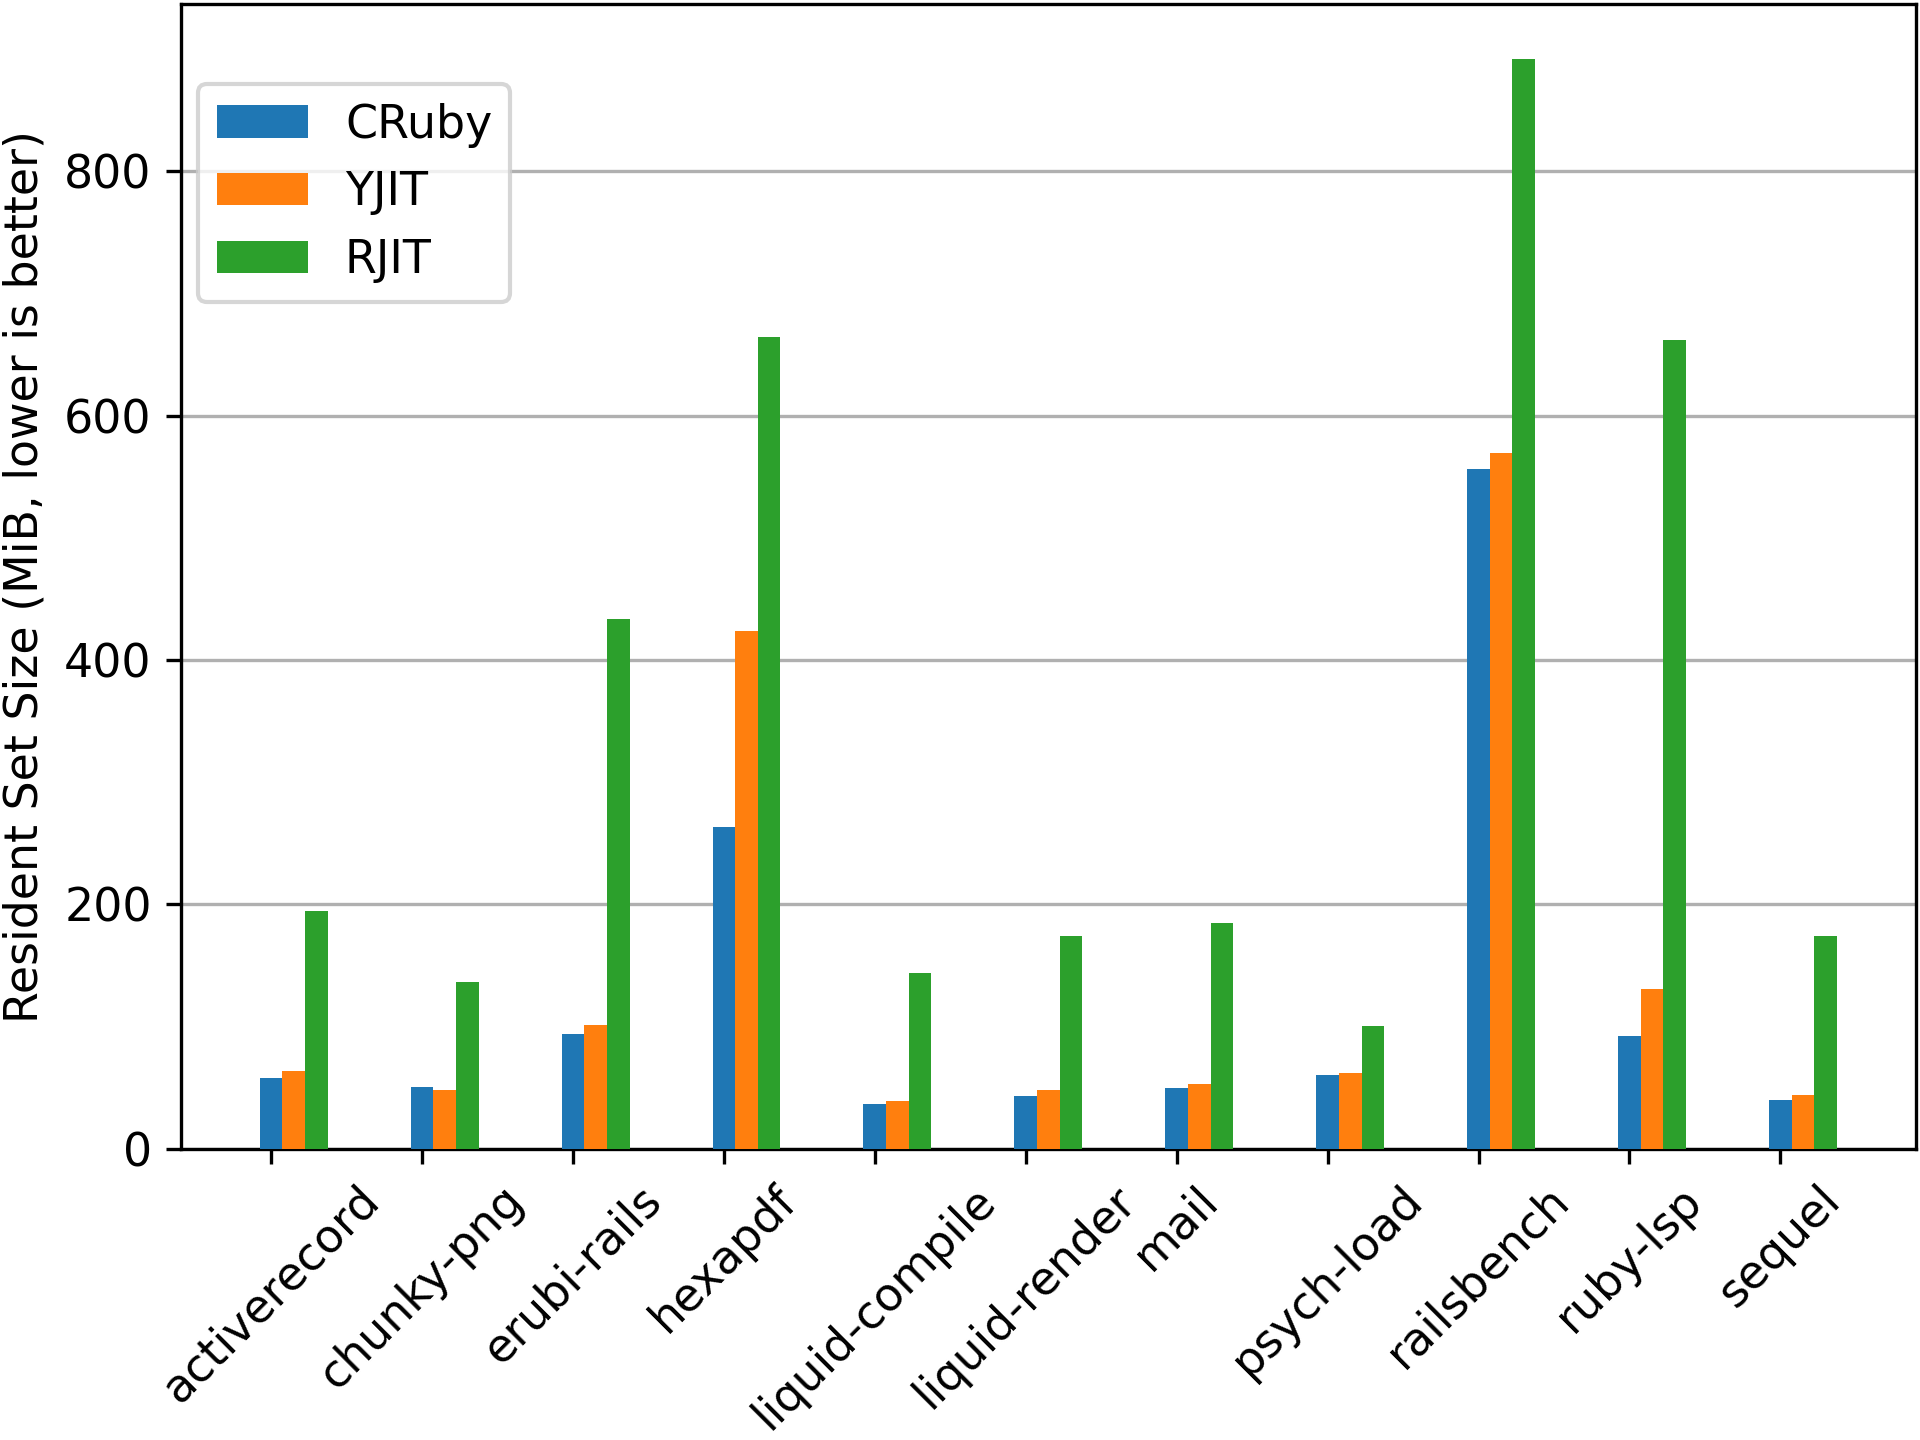
YJIT, being that it is written in Rust (a systems language), has access to more tools to optimize memory usage in places where individual bits count. Matching YJIT’s memory usage in a pure Ruby JIT would be difficult and likely would necessitate augmenting Ruby with special systems programming primitives. For example, to be able to efficiently pack structs and bit fields in memory and to also pack structs and arrays inside of other structs. Encoding data structures in memory as compactly as possible is likely challenging to do in a JVM-based JIT implementation as well.
Performance In Production
The following graph looks at the latency of YJIT on our SFR deployment when compared to servers that run the same Ruby commit with YJIT disabled. If you are wondering why no other Ruby JITs are included in this graph, it is because, at this time, other Ruby JITs could not be deployed in production for this application, either due to compatibility issues or due to memory constraints. On average, YJIT is 14.1% faster than the CRuby interpreter during the period examined. Importantly, because YJIT is able to compile new code very fast, it is also faster than the interpreter even on the slowest p99 requests.
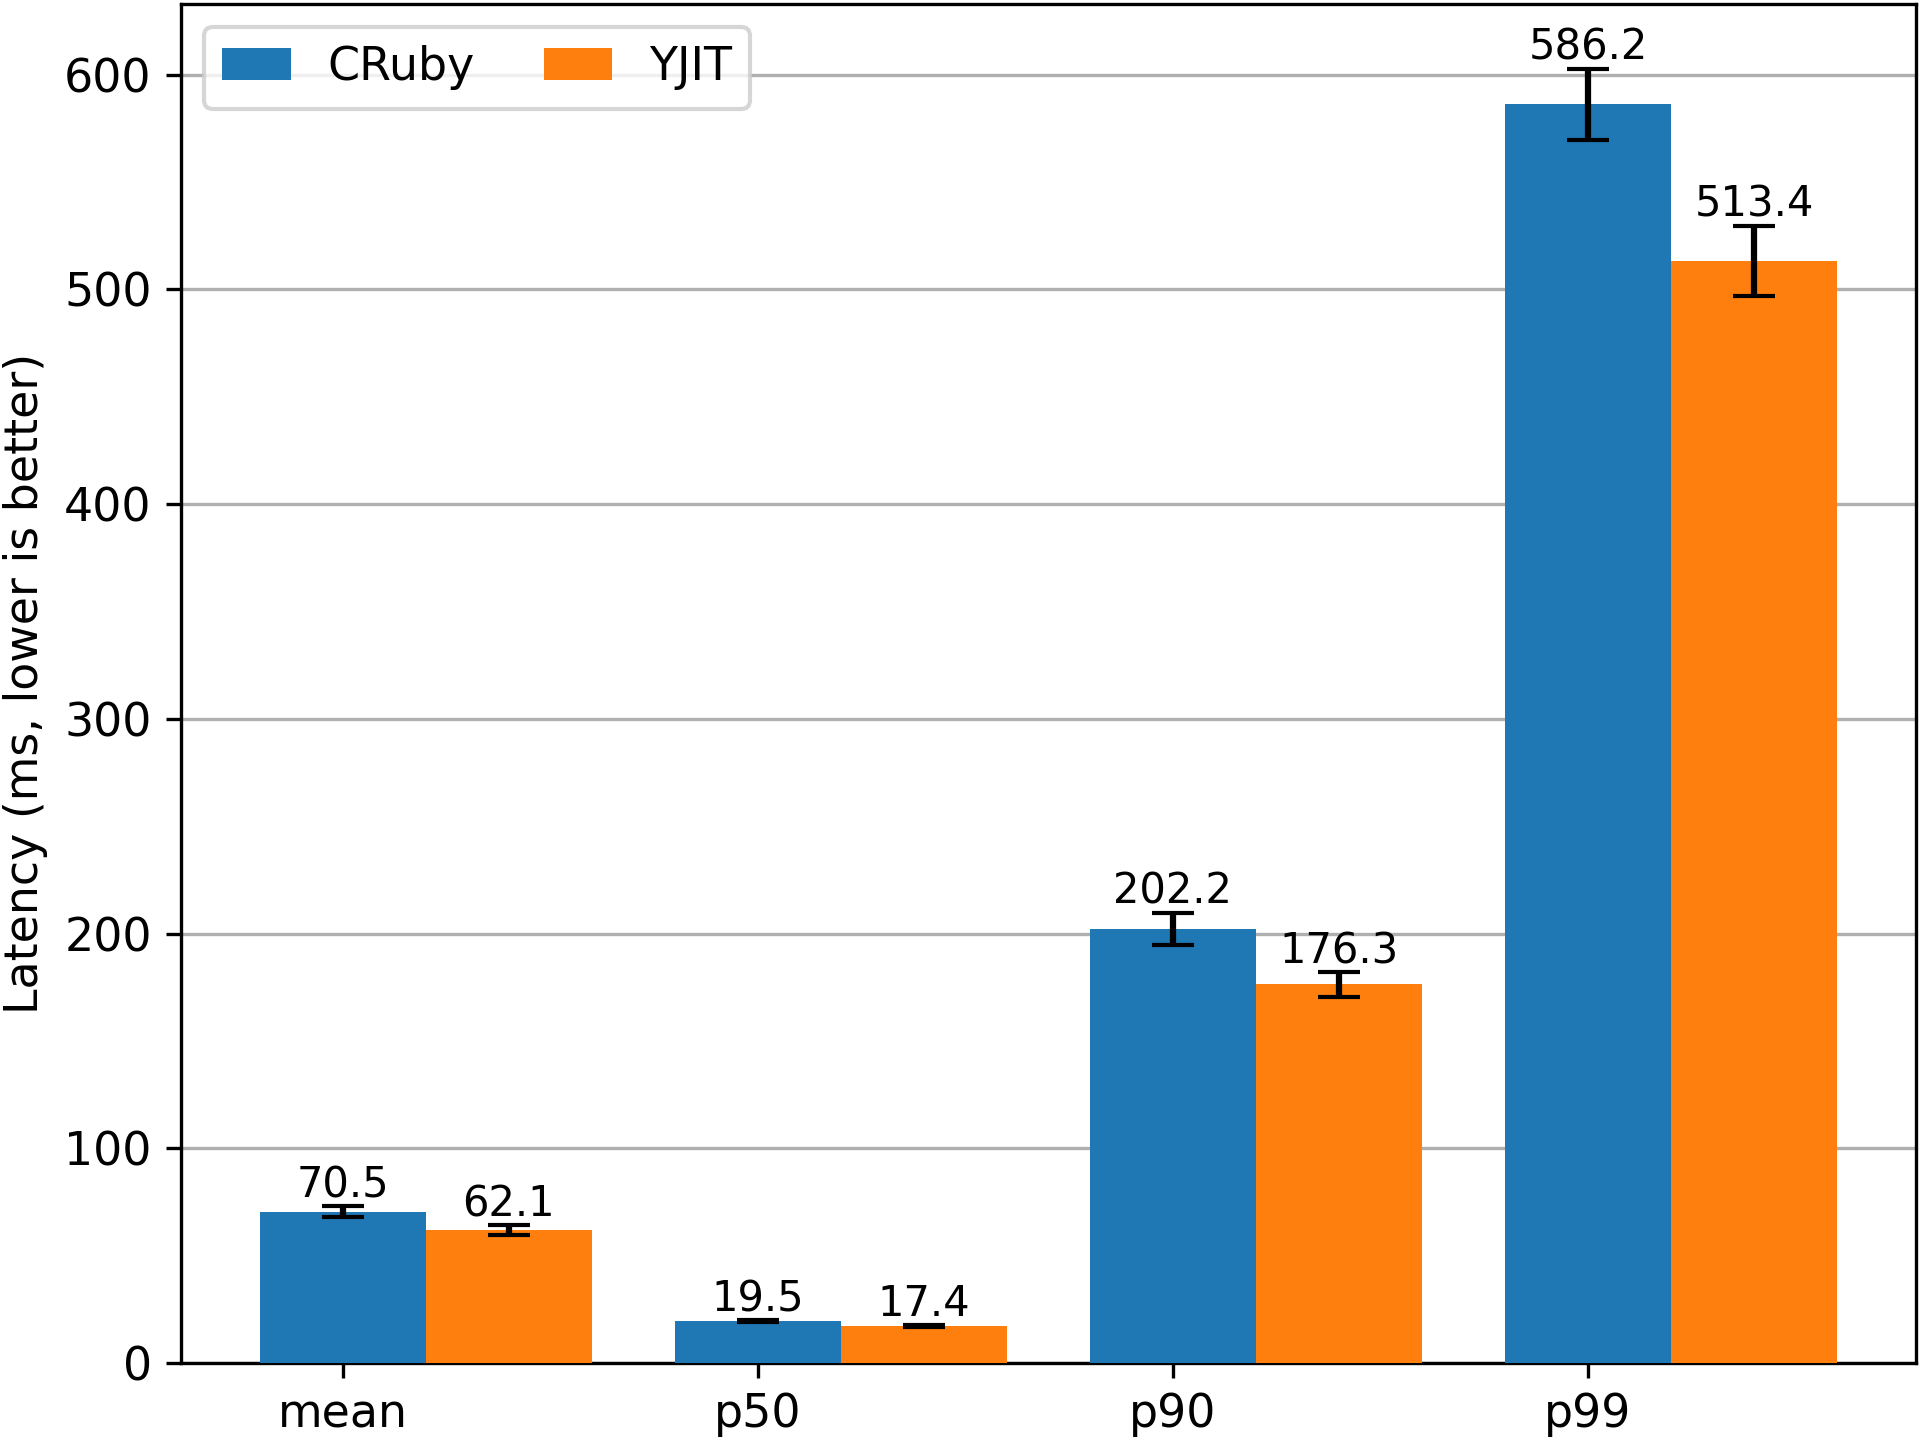
If a 14.1% speedup seems underwhelming to you, do keep in mind that the latency numbers provided measure the total time needed to generate a response. This includes not only time spent in JIT-compiled code, but also time spent in C functions that we cannot optimize, and time the server spends waiting for database requests and other I/O operations.
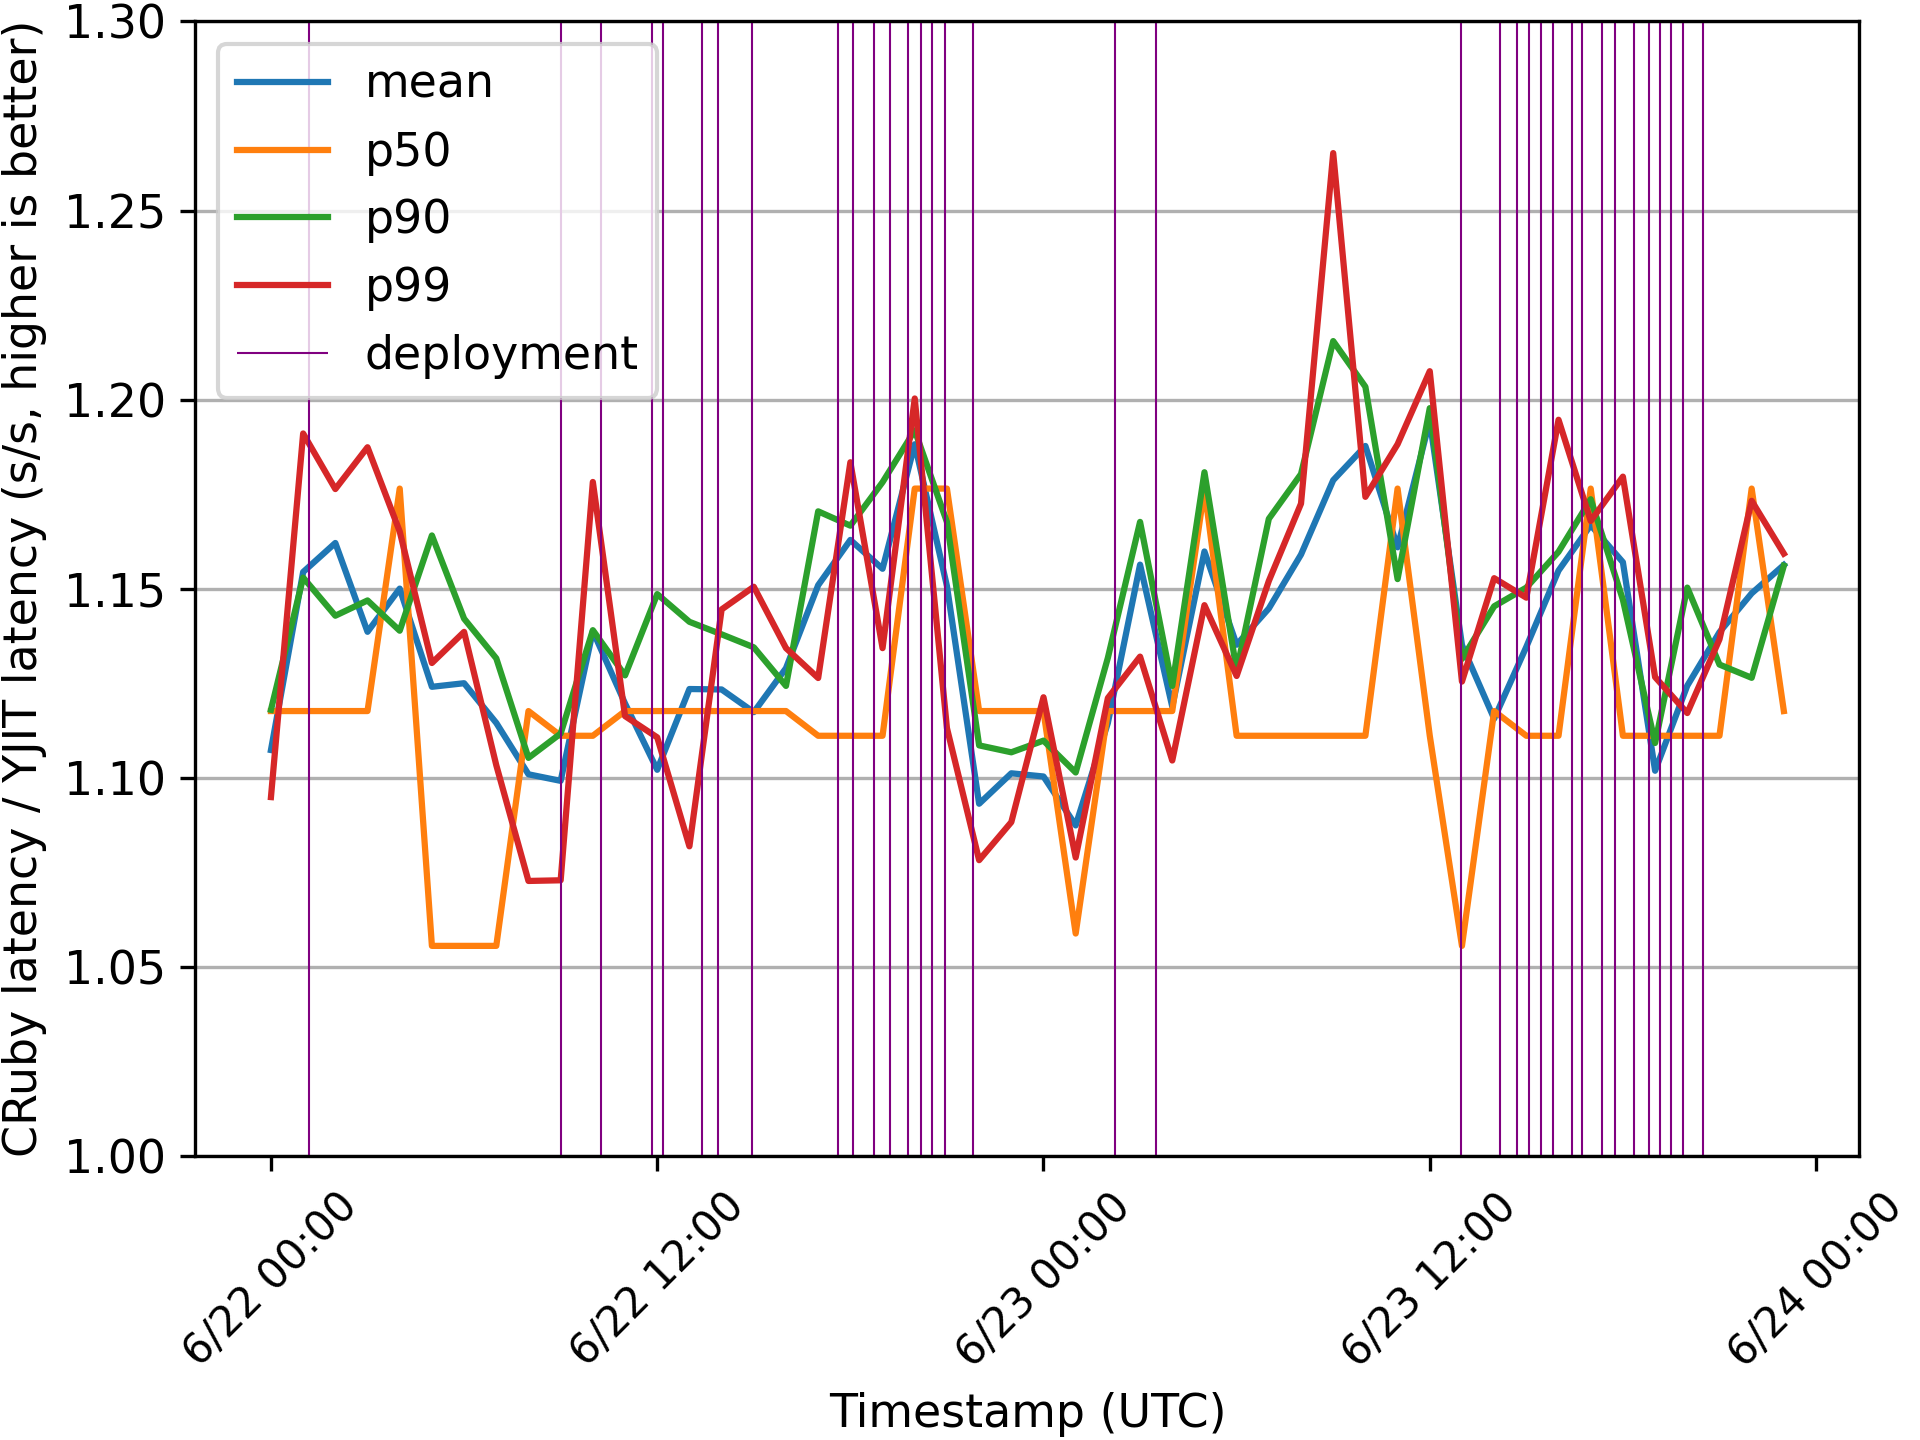
The graph above shows the speedup provided by YJIT over the interpreter. The purple vertical lines represent deployments. During the time period we examined, there were 35 deployments of new code to production, and the shortest interval during consecutive deployments was just 19 minutes 21 seconds. The key takeaway here is that even though we perform frequent deployments during the daytime, because YJIT is able to warm up very fast, it remains consistently faster than the interpreter. Again, more information is provided in the paper, including data about YJIT’s memory usage in our production deployments.
Conclusion
We’ve recently published a paper about YJIT at MPLR 2023, in which we evaluate YJIT’s performance on both benchmarks as well as on Shopify’s flagship production deployment, which serves an enormous amount of traffic worldwide. In this paper, we make it a point to examine not just peak performance, but to also discuss and evaluate warm-up time and total memory usage.
The YJIT team has spent a significant amount of effort optimizing YJIT so that it doesn’t just show good peak performance numbers, but also does this while being memory-efficient. This effort has paid off, with YJIT having the least memory overhead of any Ruby JIT, which has been crucial in enabling YJIT to handle Shopify’s SFR deployment.
Since our MPLR paper was published, we’ve kept improving YJIT’s performance. YJIT now provides a 20%+ performance boost over the interpreter on our SFR deployment. With the Ruby 3.3 release approaching, there will be a lot to be excited about this holiday season, as we are once again gearing up for a very strong Ruby release. This year, YJIT 3.3 will deliver better performance, while using less memory, and also warming up faster than YJIT 3.2. Expect another post on the Rails at Scale blog with more benchmark results soon!
For more information on how to use YJIT, see the YJIT README. Should you wish to cite our MPLR 2023 paper, I’ve also included the bibtex snippet below:
@inproceedings{yjit_mplr_2023,
author = {Chevalier-Boisvert, Maxime and Kokubun, Takashi and Gibbs, Noah and Wu, Si Xing (Alan) and Patterson, Aaron and Issroff, Jemma},
title = {Evaluating YJIT’s Performance in a Production Context: A Pragmatic Approach},
year = {2023},
isbn = {9798400703805},
publisher = {Association for Computing Machinery},
address = {New York, NY, USA},
url = {https://doi.org/10.1145/3617651.3622982},
doi = {10.1145/3617651.3622982},
booktitle = {Proceedings of the 20th ACM SIGPLAN International Conference on Managed Programming Languages and Runtimes},
pages = {20–33},
numpages = {14},
keywords = {dynamically typed, optimization, just-in-time, virtual machine, ruby, compiler, bytecode},
location = {Cascais, Portugal},
series = {MPLR 2023}
}